Copyright
©The Author(s) 2015.
World J Diabetes. Apr 15, 2015; 6(3): 489-499
Published online Apr 15, 2015. doi: 10.4239/wjd.v6.i3.489
Published online Apr 15, 2015. doi: 10.4239/wjd.v6.i3.489
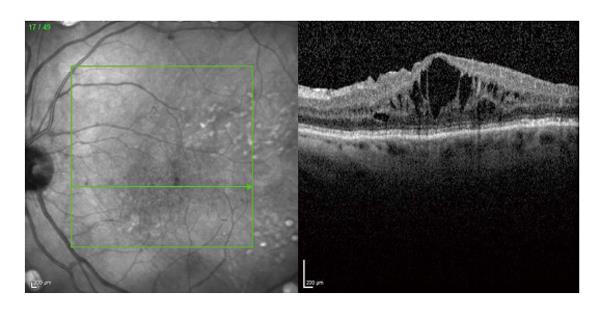
Figure 11 Spectral-domain optical coherence tomography of a female patient with center-involving diabetic macular edema.
On the left side of the picture, an infra-red image shows the exact location of the OCT-scan on the right. The OCT-scan visualizes intraretinal edema with thickening of the fovea. OCT: Optical coherence tomography.
- Citation: Nentwich MM, Ulbig MW. Diabetic retinopathy - ocular complications of diabetes mellitus. World J Diabetes 2015; 6(3): 489-499
- URL: https://www.wjgnet.com/1948-9358/full/v6/i3/489.htm
- DOI: https://dx.doi.org/10.4239/wjd.v6.i3.489


