Copyright
©The Author(s) 2015.
World J Diabetes. Feb 15, 2015; 6(1): 17-29
Published online Feb 15, 2015. doi: 10.4239/wjd.v6.i1.17
Published online Feb 15, 2015. doi: 10.4239/wjd.v6.i1.17
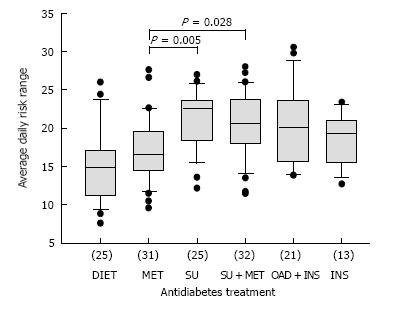
Figure 2 Differentiation between treatment groups of type 2 diabetic patients using the average daily risk range scores.
Sample size for each group is given in parenthesis. Between-treatment group differences were evaluated by one-way analysis of variance and are statistically significant (P < 0.001). MET: Metformin; SU: Sulfonylurea; OAD: Oral antidiabetic drugs; INS: Insulin (Kohnert et al, Unpublished data).
- Citation: Kohnert KD, Heinke P, Vogt L, Salzsieder E. Utility of different glycemic control metrics for optimizing management of diabetes. World J Diabetes 2015; 6(1): 17-29
- URL: https://www.wjgnet.com/1948-9358/full/v6/i1/17.htm
- DOI: https://dx.doi.org/10.4239/wjd.v6.i1.17


