Copyright
©2014 Baishideng Publishing Group Co.
World J Diabetes. Feb 15, 2014; 5(1): 59-68
Published online Feb 15, 2014. doi: 10.4239/wjd.v5.i1.59
Published online Feb 15, 2014. doi: 10.4239/wjd.v5.i1.59
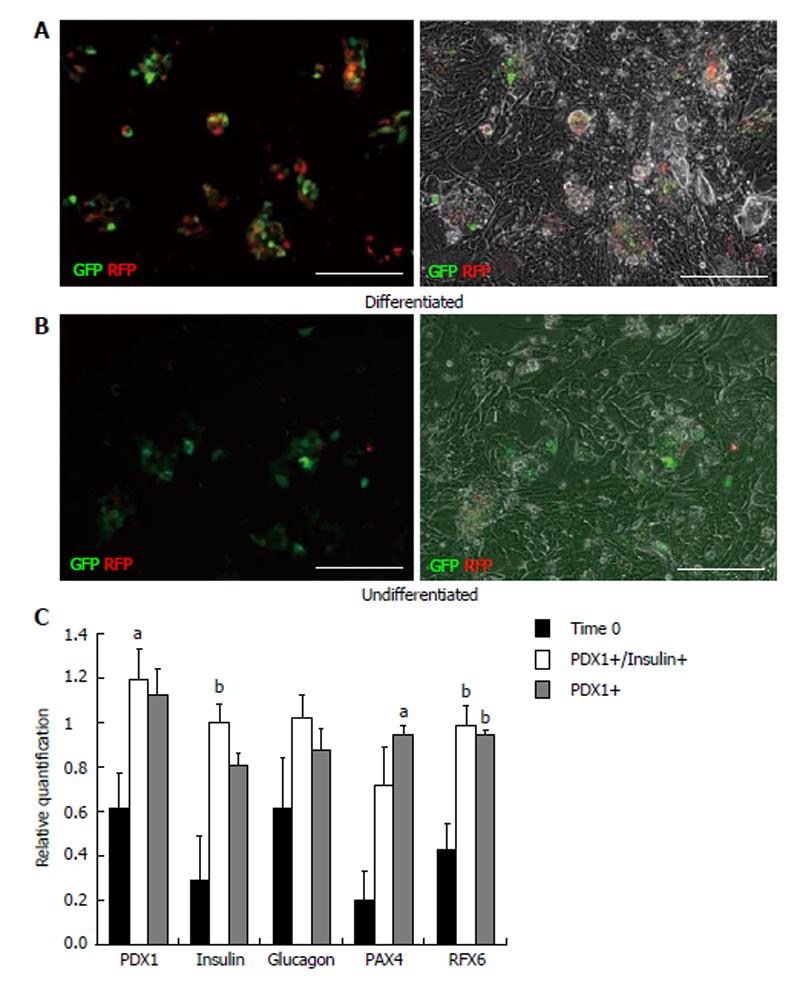
Figure 2 Comparison of differentiated and undifferentiated islet cells infected with PDX1-monomeric red fluorescent protein/insulin 1-enhanced green fluorescent protein.
Islet cells cultured in differentiation medium (A) form adherent cell aggregates within the cell monolayer and insulin+ (GFP) and PDX1+ (RFP) expressing cells are localized within these cell aggregates. Islet cells cultured in control medium (B, undifferentiated) have fewer cell aggregates and insulin (GFP) and PDX1+ (RFP) cells. Scale bars are 100 μm. Gene expression (C) of PDX1-monomeric red fluorescent protein (mRFP)/insulin-enhanced green fluorescent protein islet cells (PDX1+ insulin+, white bars; n = 7) and PDX1-mRFP infected islet cells (PDX1+, grey bars; n = 4) post-differentiation compared to starting islet tissue (Time 0, black bars; n = 8) measured by real-time PCR. aP < 0.05 and bP < 0.01 compared to Time 0. RFP: Red fluorescent protein.
- Citation: Seeberger KL, Anderson SJ, Ellis CE, Yeung TY, Korbutt GS. Identification and differentiation of PDX1 β-cell progenitors within the human pancreatic epithelium. World J Diabetes 2014; 5(1): 59-68
- URL: https://www.wjgnet.com/1948-9358/full/v5/i1/59.htm
- DOI: https://dx.doi.org/10.4239/wjd.v5.i1.59


