Copyright
©2014 Baishideng Publishing Group Co.
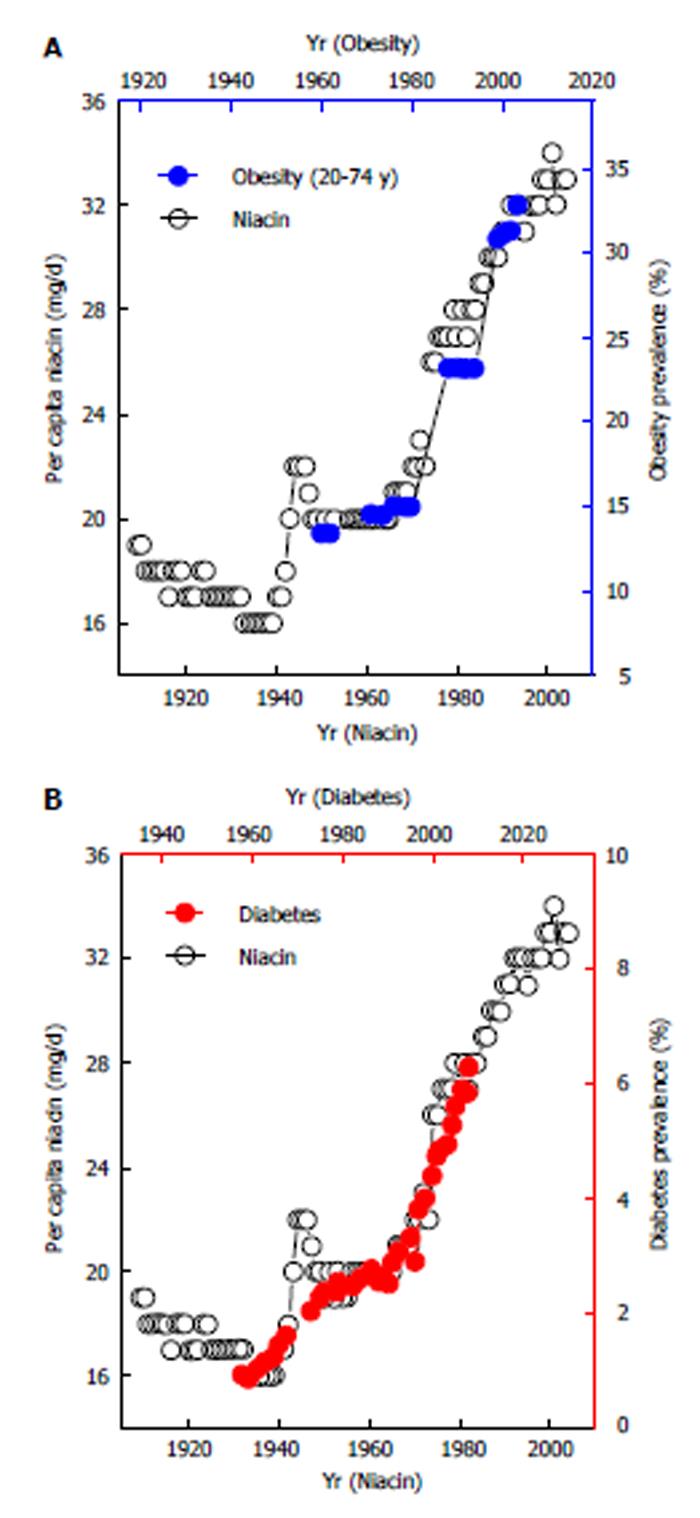
Figure 3 Lagged correlations between United States per capita niacin consumption and the prevalence of obesity and diabetes.
The lag time between per capita niacin consumption and the prevalence of obesity and diabetes is 10 (A) and 26 years (B), respectively[25,26].
- Citation: Zhou SS, Zhou Y. Excess vitamin intake: An unrecognized risk factor for obesity. World J Diabetes 2014; 5(1): 1-13
- URL: https://www.wjgnet.com/1948-9358/full/v5/i1/1.htm
- DOI: https://dx.doi.org/10.4239/wjd.v5.i1.1


