
















Copyright: ©Author(s) 2026.
World J Diabetes. Sep 15, 2026; 17(9): 123886
Published online Sep 15, 2026. doi: 10.4239/wjd.123886
Published online Sep 15, 2026. doi: 10.4239/wjd.123886
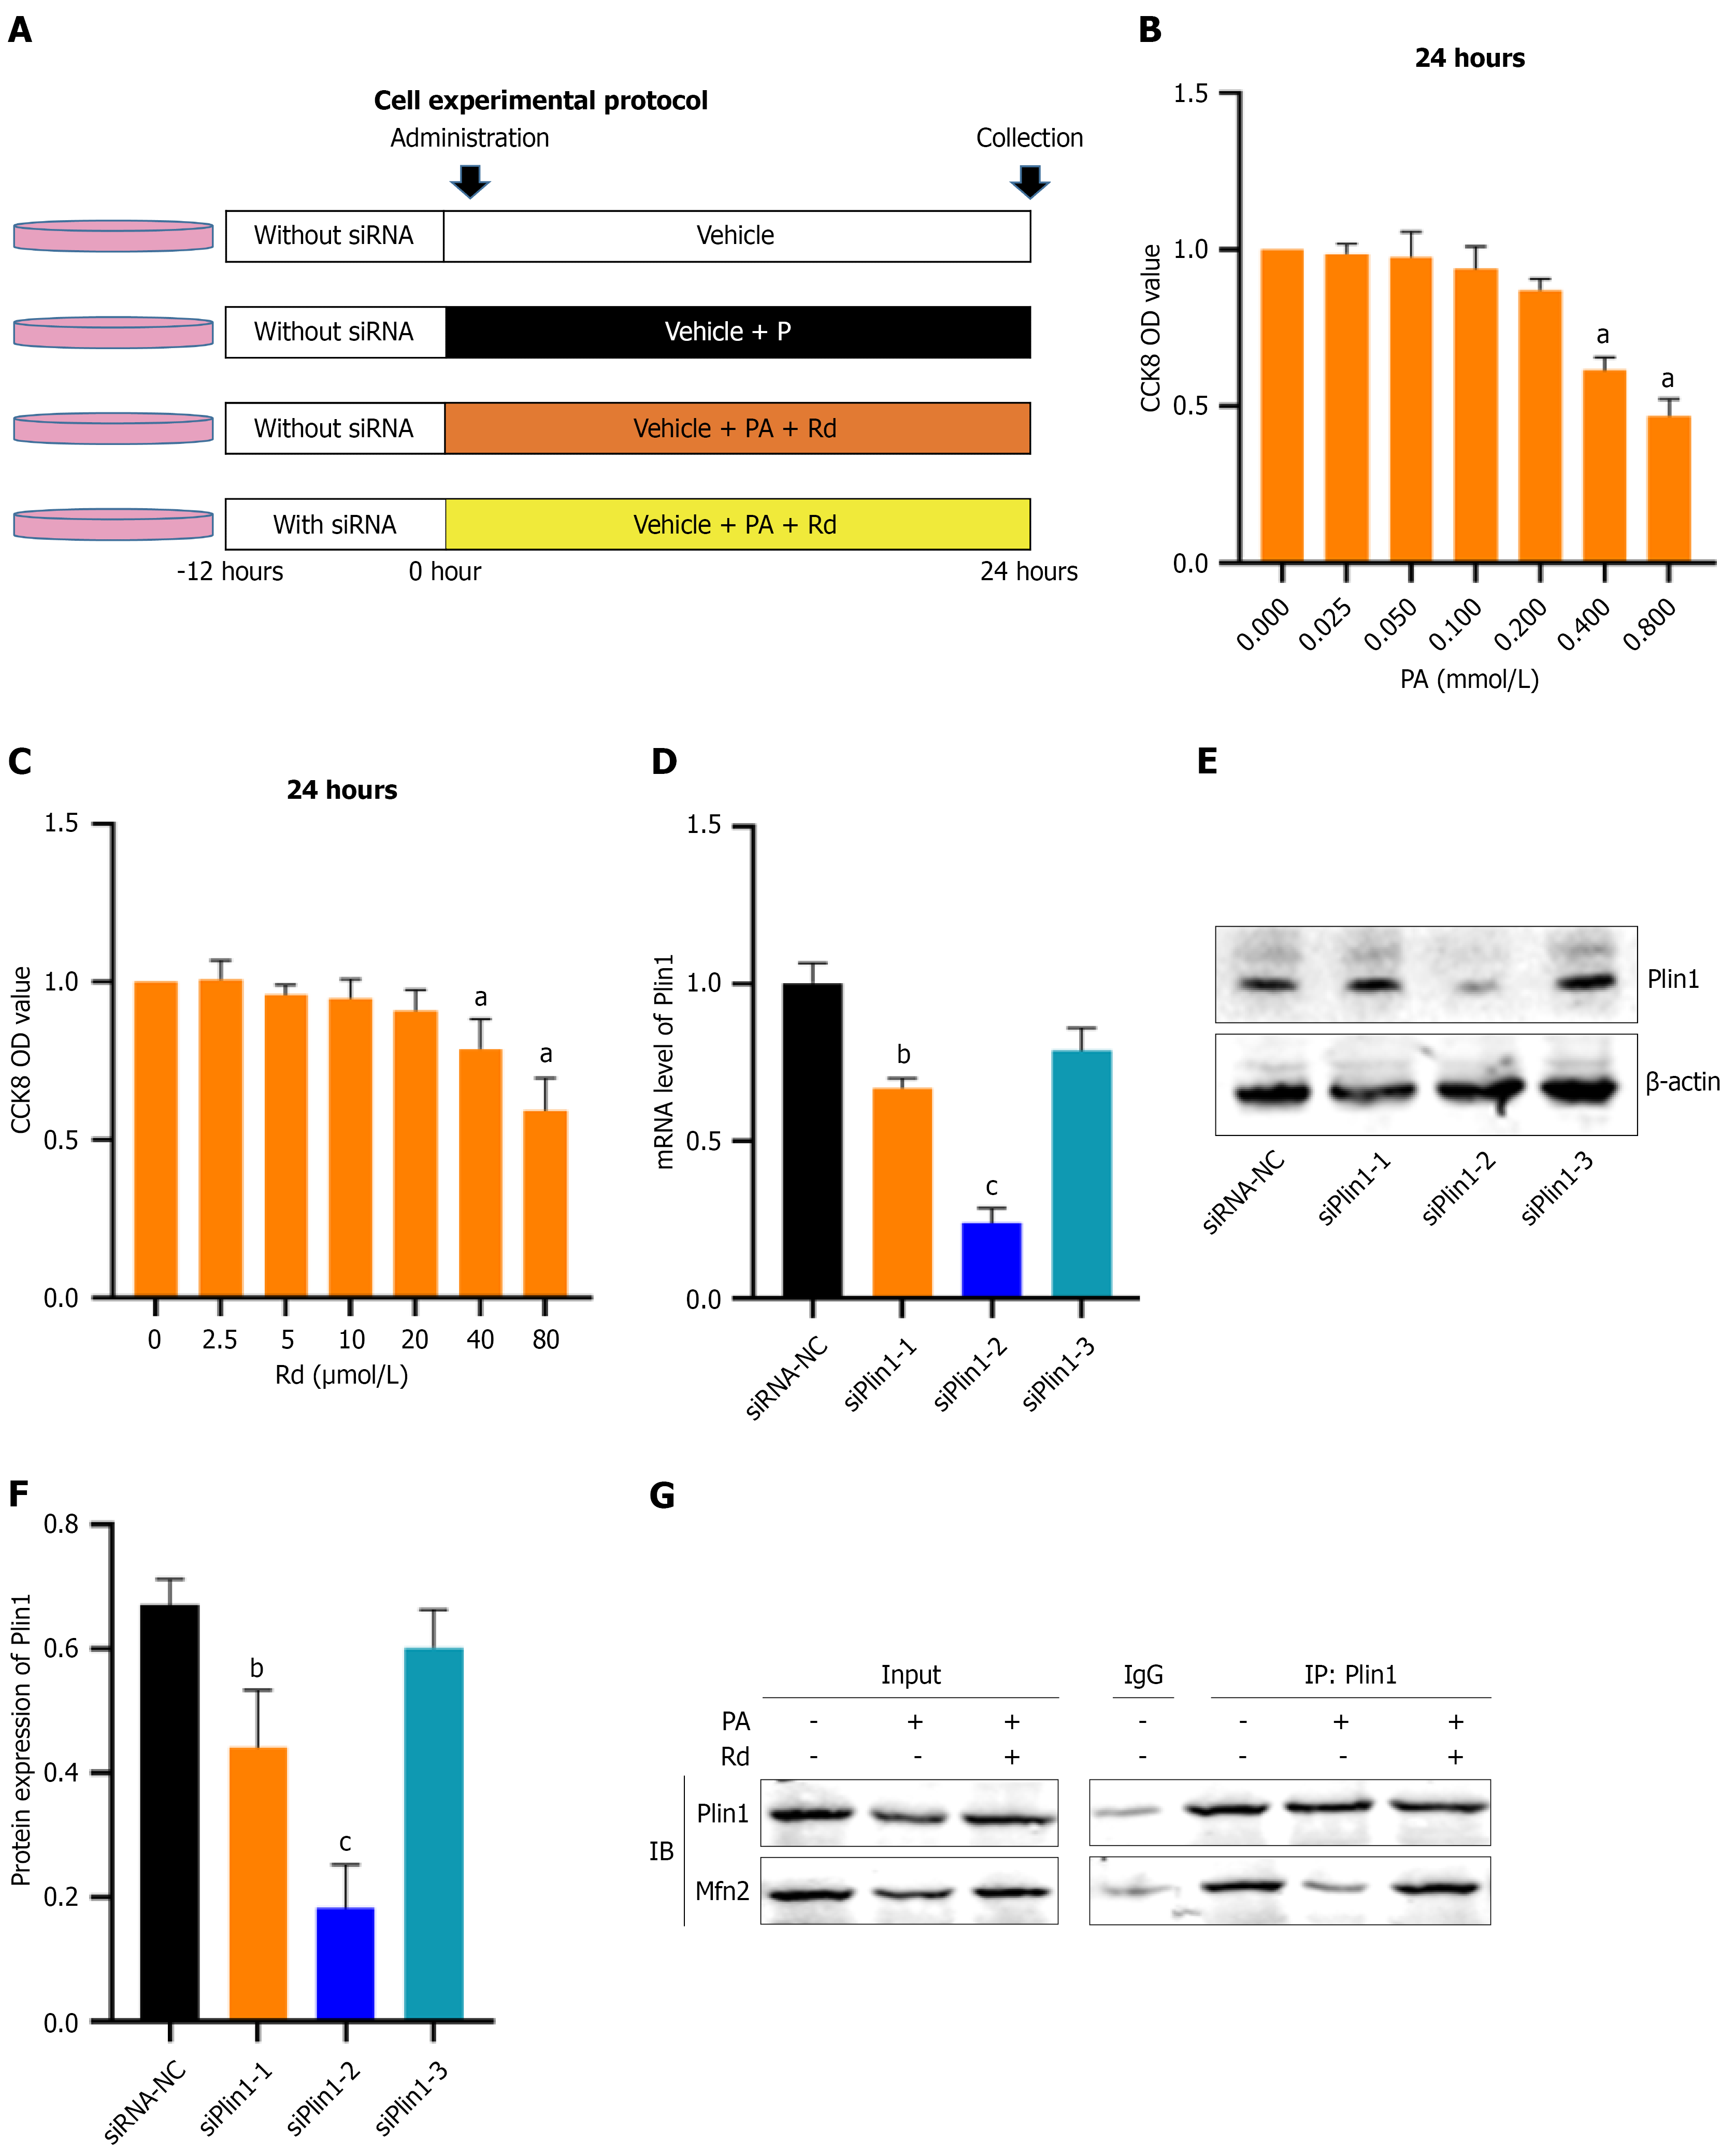
Figure 8 CCK-8 and siRNA in HK-2 cells.
A: HK-2 experimental protocol; B: The CCK-8 of palmitic acid (n = 4); C: The CCK-8 of Rd (n = 4); D: Knockdown efficiency of si-perilipin (Plin) 1 at mRNA level (n = 3); E: Western blot bands of si-Plin1; F: Knockdown efficiency of si-Plin1 at protein level (n = 3); G: Co-immunoprecipitation analysis of the interaction between Plin1 and mitofusin 2 (n = 3). Data are presented as mean ± SEM. aP < 0.05 compared with control group; bP < 0.05, cP < 0.01 compared with negative control siRNA group. Plin1: Perilipin 1; Mfn2: Mitofusin 2; PA: Palmitic acid; IgG: Immunoglobulin G; siRNA-NC: Negative control siRNA.
- Citation: Wu WB, Tao Y, Xu NJ, Shao QQ, Yuan F, Dong H, Lu FE, Zheng CH, Wu F. Ginsenoside Rd promote the contact between mitochondria and lipid droplets through Plin1/Mfn2 to treat diabetic kidney disease. World J Diabetes 2026; 17(9): 123886
- URL: https://www.wjgnet.com/1948-9358/full/v17/i9/123886.htm
- DOI: https://dx.doi.org/10.4239/wjd.123886