
















Copyright: ©Author(s) 2026.
World J Diabetes. Sep 15, 2026; 17(9): 123886
Published online Sep 15, 2026. doi: 10.4239/wjd.123886
Published online Sep 15, 2026. doi: 10.4239/wjd.123886
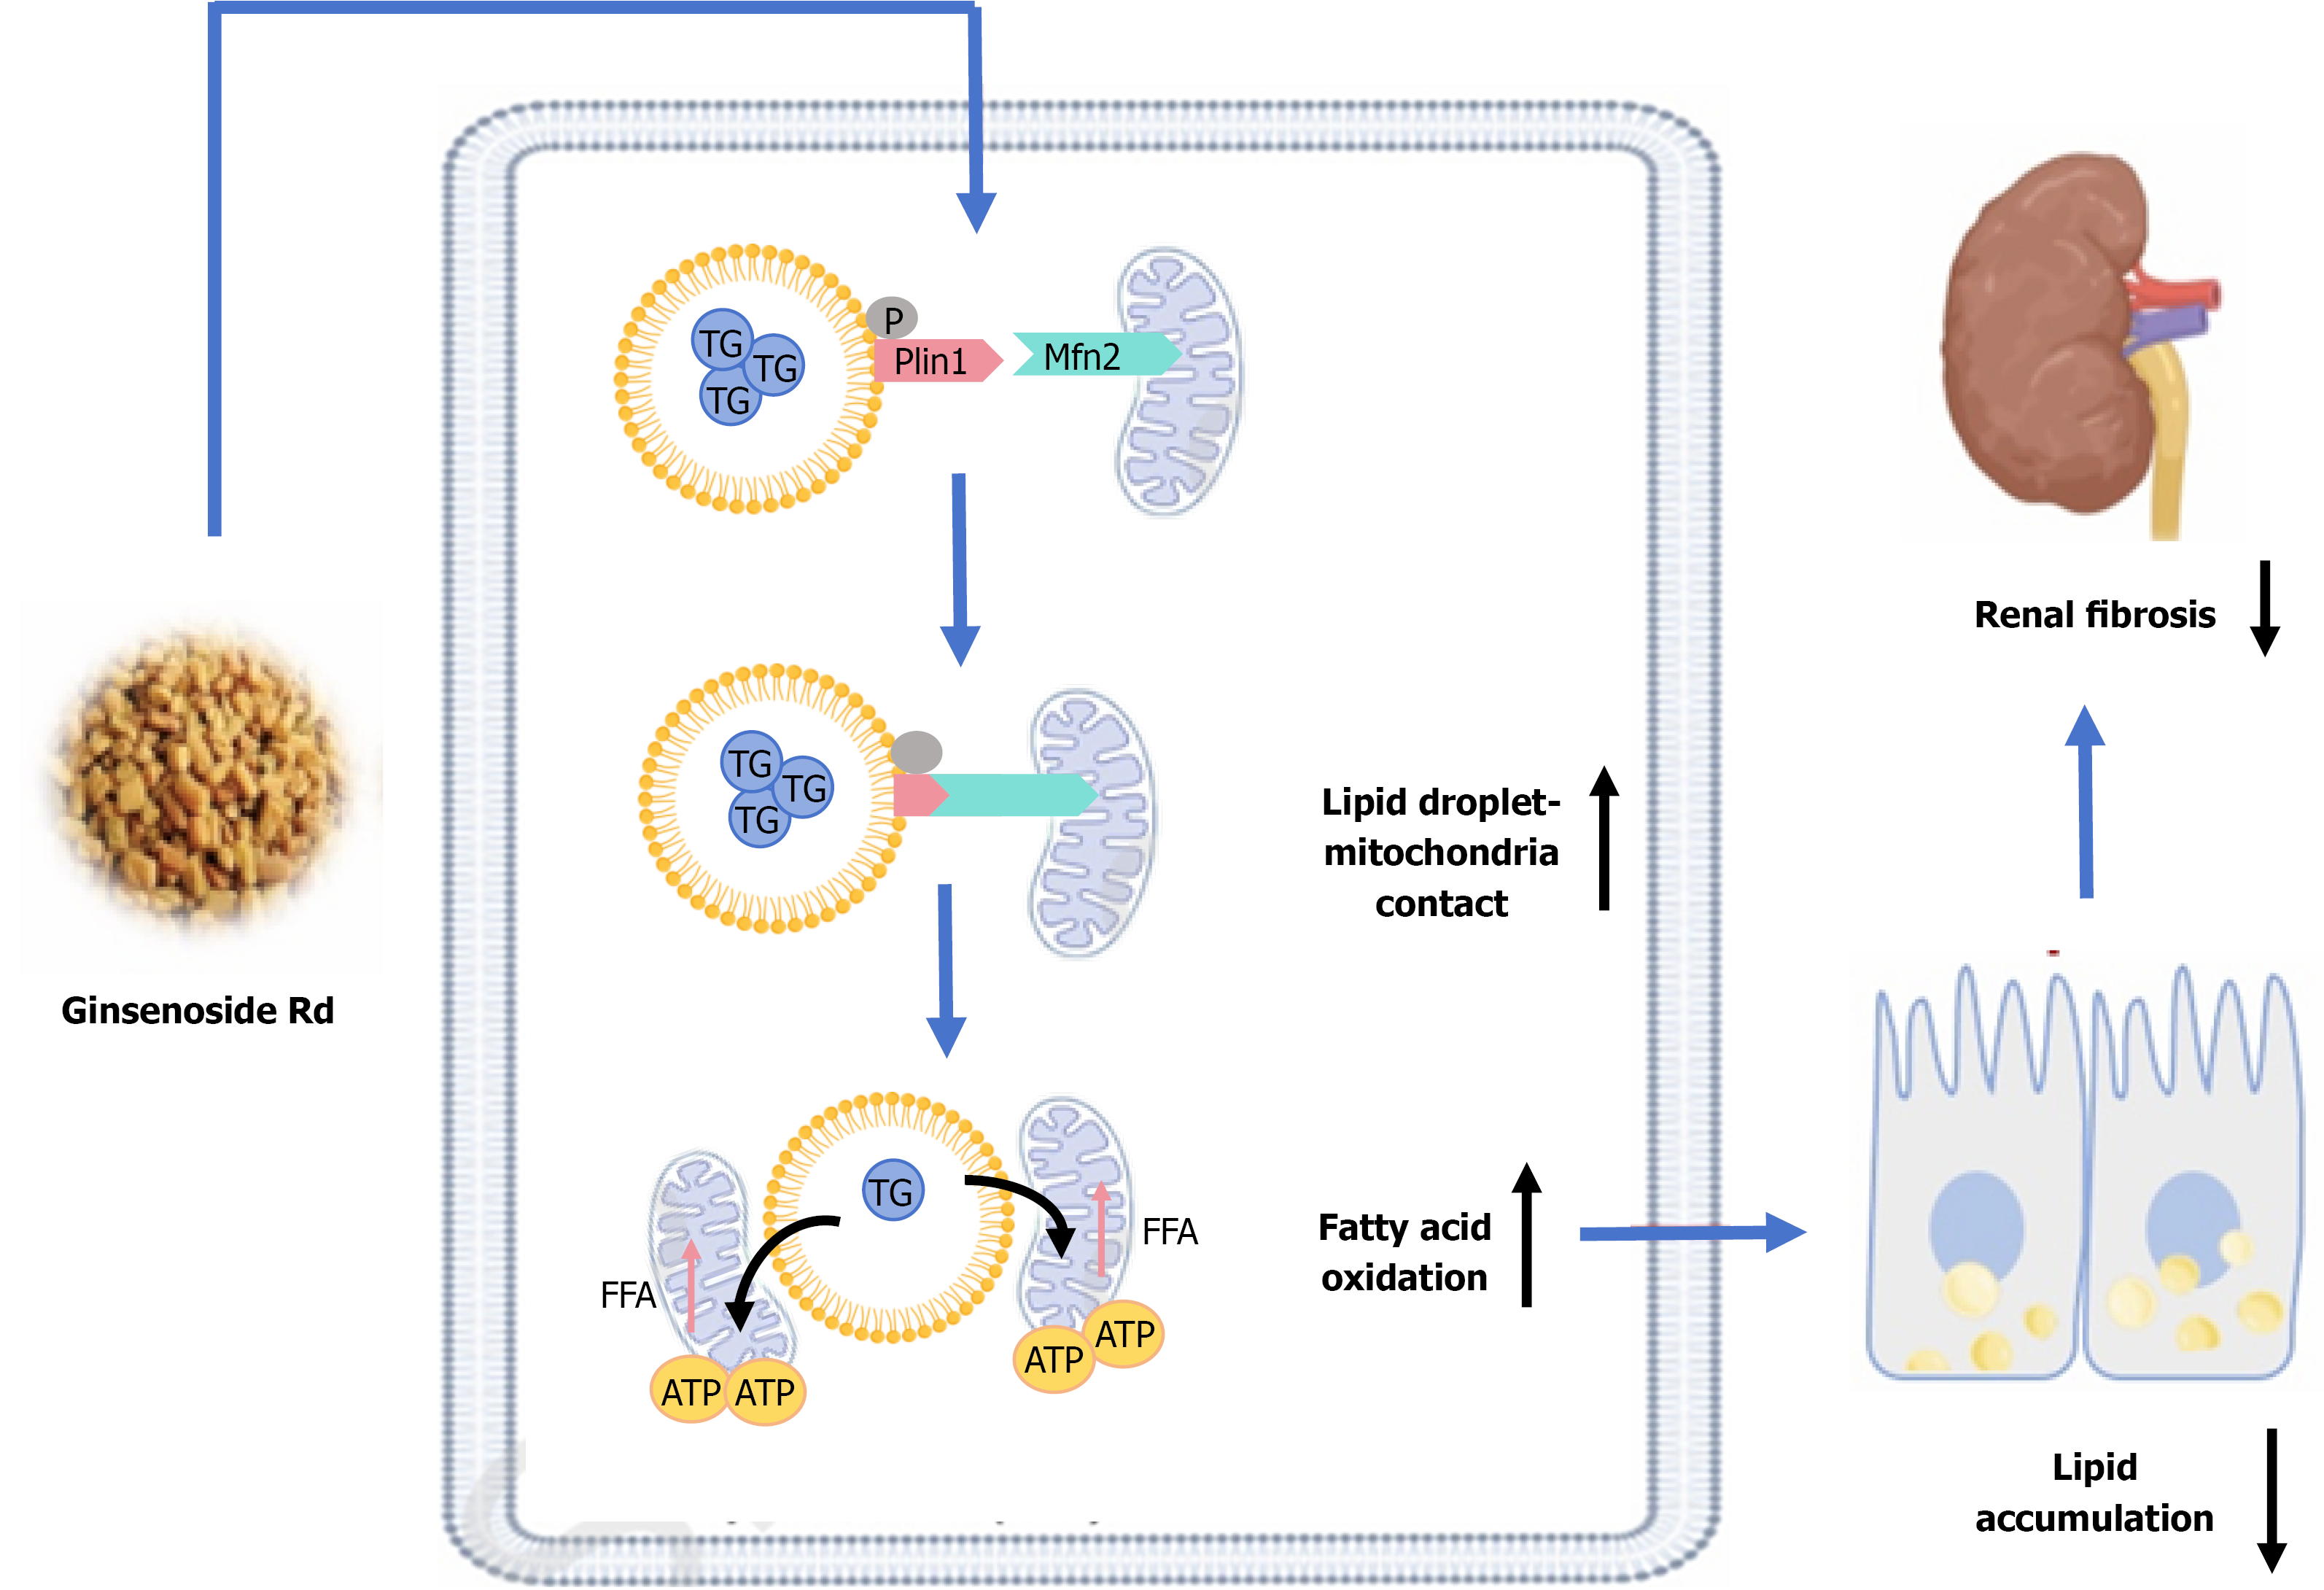
Figure 1 Proposed mechanism by which ginsenoside Rd promote the contact between mitochondria and lipid droplets through perilipin 1/mitofusin 2.
FFA: Free fatty acid; ATP: Adenosine triphosphate.
- Citation: Wu WB, Tao Y, Xu NJ, Shao QQ, Yuan F, Dong H, Lu FE, Zheng CH, Wu F. Ginsenoside Rd promote the contact between mitochondria and lipid droplets through Plin1/Mfn2 to treat diabetic kidney disease. World J Diabetes 2026; 17(9): 123886
- URL: https://www.wjgnet.com/1948-9358/full/v17/i9/123886.htm
- DOI: https://dx.doi.org/10.4239/wjd.123886