
















Copyright: ©Author(s) 2026.
World J Diabetes. Sep 15, 2026; 17(9): 123276
Published online Sep 15, 2026. doi: 10.4239/wjd.123276
Published online Sep 15, 2026. doi: 10.4239/wjd.123276
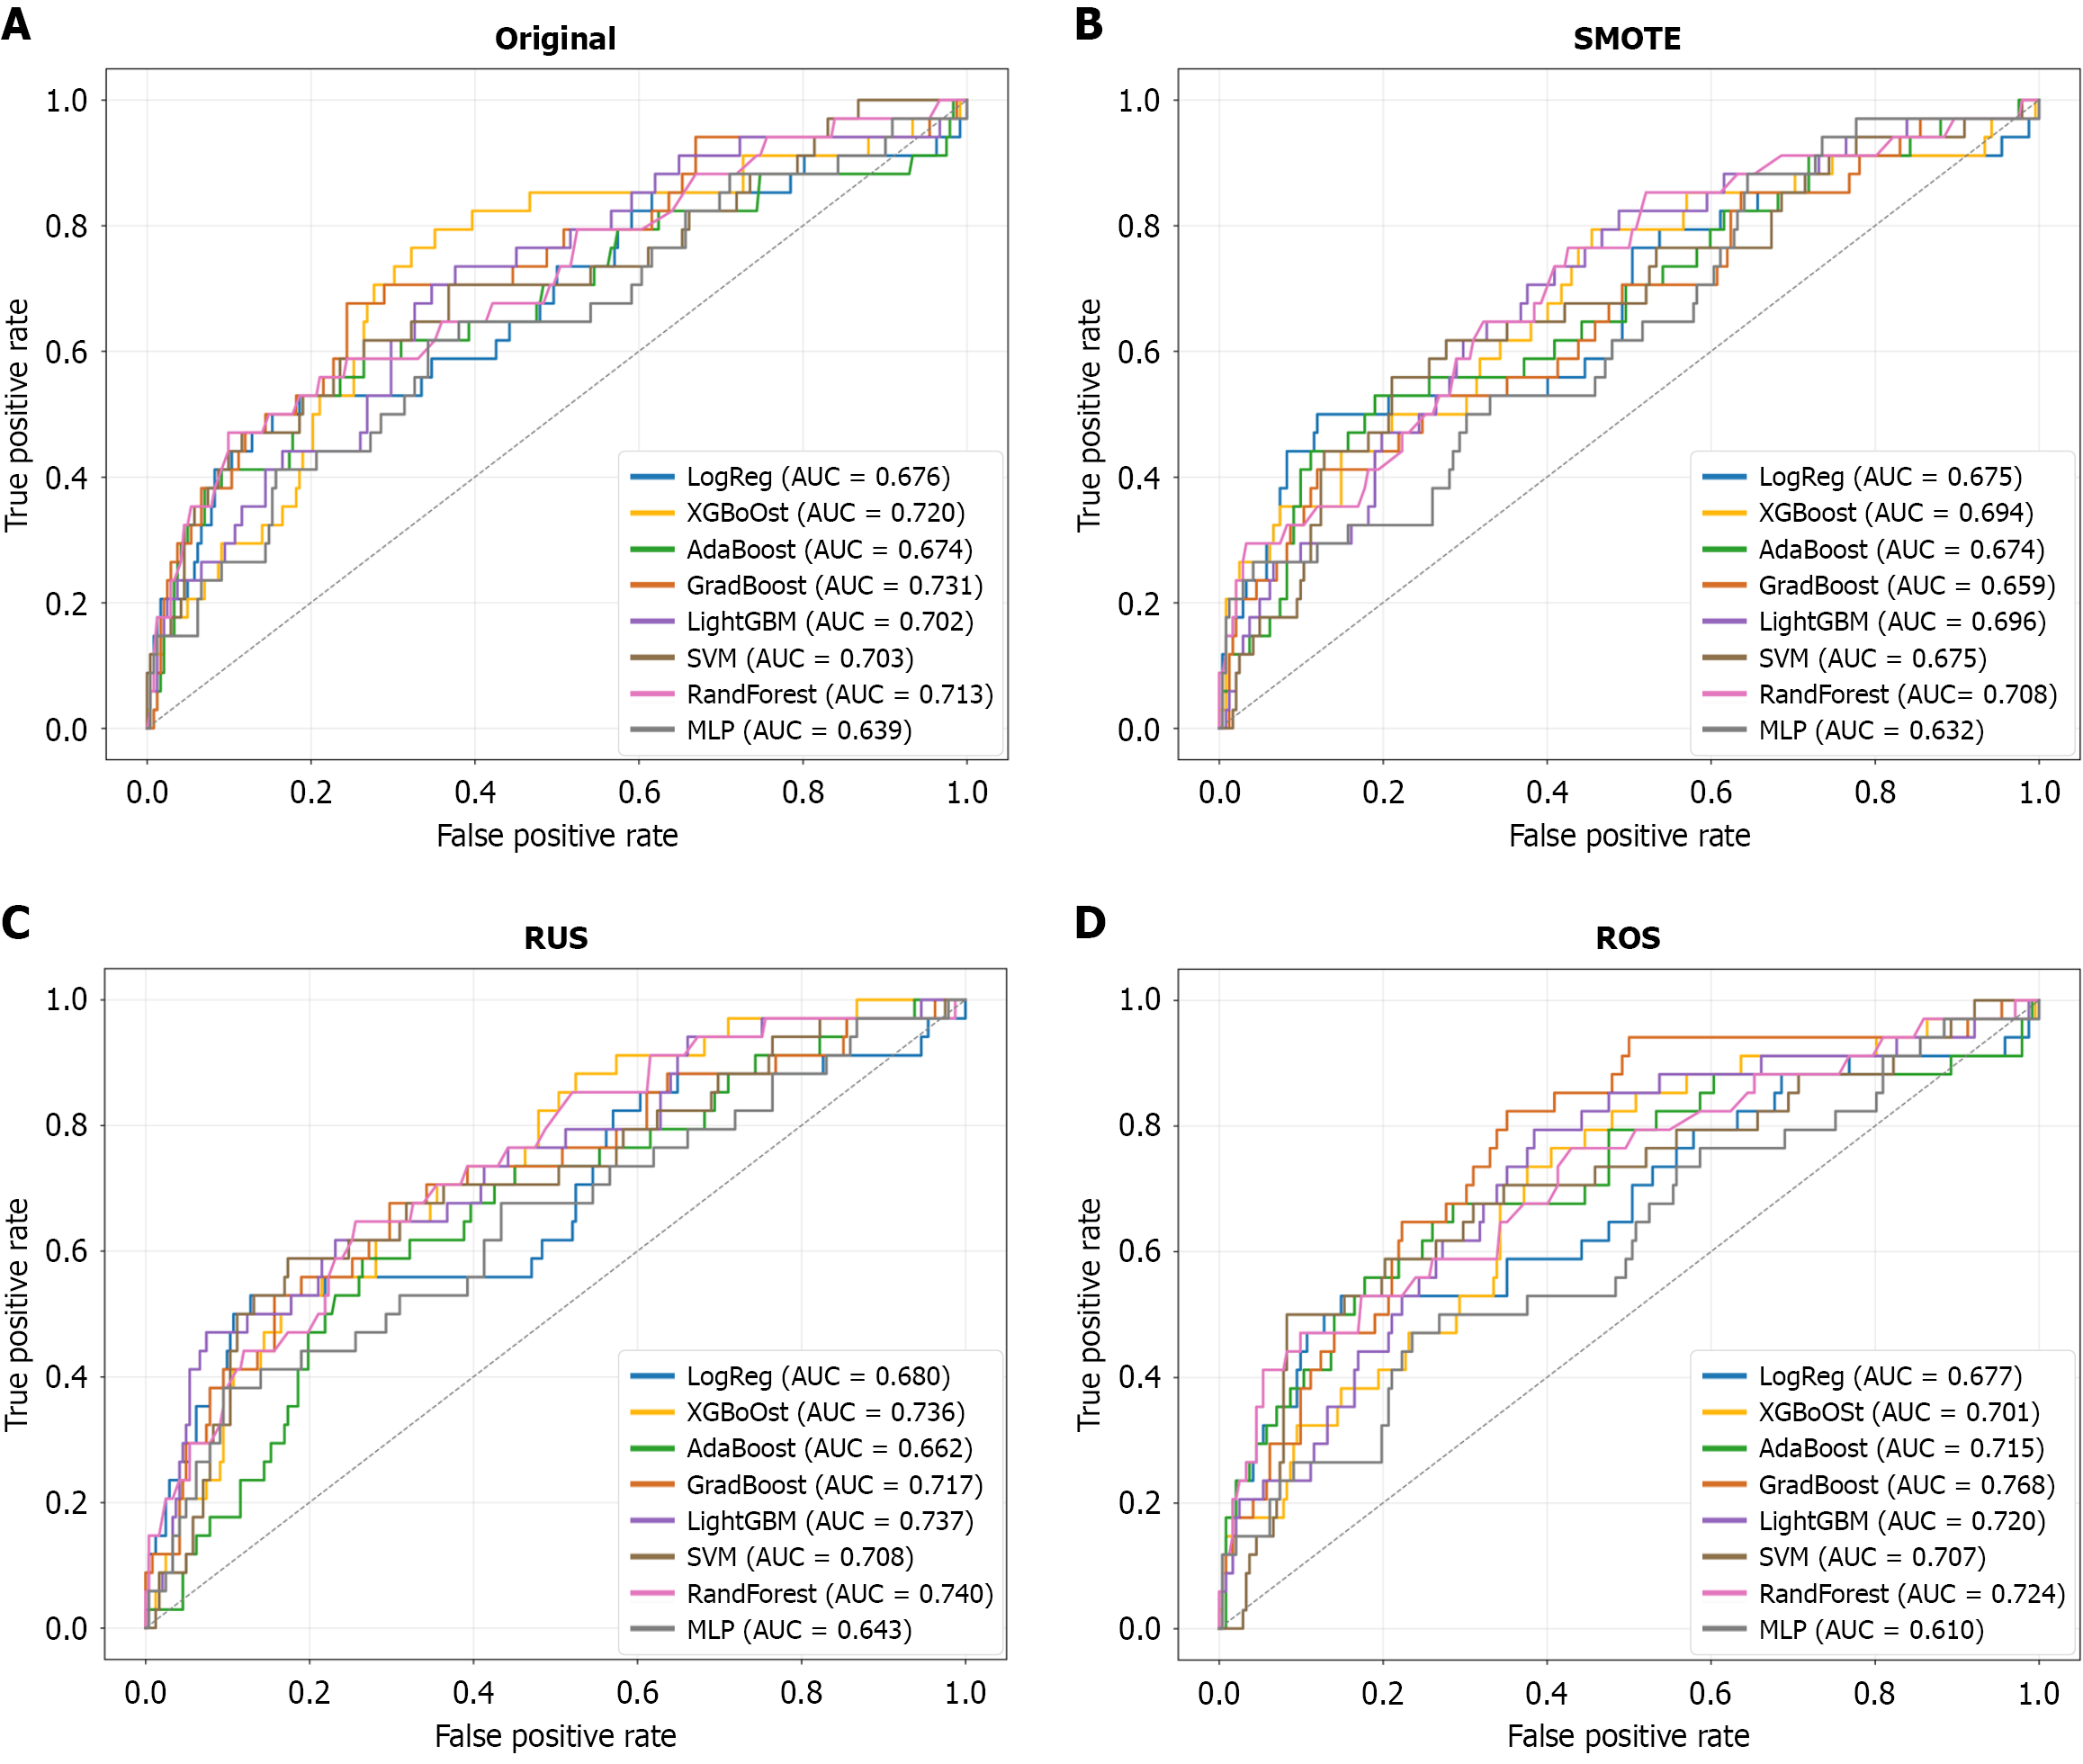
Figure 2 Receiver operating characteristic curves comparing the predictive performance of multiple machine learning models for gestational diabetes mellitus prediction under different class imbalance handling strategies on the independent test set.
A: Original dataset without resampling; B: Synthetic minority oversampling technique; C: Random undersampling; D: Random oversampling. The evaluated models included logistic regression, extreme gradient boosting, adaptive boosting, gradient boosting, light gradient boosting machine, support vector machine, random forest, and multilayer perceptron. The X-axis represents the false positive rate, and the Y-axis represents the true positive rate. The diagonal dashed line indicates random classification performance. The area under the curve values for each model are shown in the corresponding legends. SMOTE: Synthetic minority oversampling technique; RUS: Random undersampling; ROS: Random oversampling; LogReg: Logistic regression; XGBoost: Extreme gradient boosting; AdaBoost: Adaptive boosting; GradBoost: Gradient boosting; LightGBM: Light gradient boosting machine; SVM: Support vector machine; RandForest: Random forest; MLP: Multilayer perceptron; AUC: Area under the curve.
- Citation: Hung SM, Chen CP, Sun FJ, Chen YY, Wang LK, Chen CY. Early risk stratification of gestational diabetes using interpretable machine learning with first-trimester screening parameters. World J Diabetes 2026; 17(9): 123276
- URL: https://www.wjgnet.com/1948-9358/full/v17/i9/123276.htm
- DOI: https://dx.doi.org/10.4239/wjd.123276