











Copyright: ©Author(s) 2026.
World J Diabetes. Sep 15, 2026; 17(9): 122419
Published online Sep 15, 2026. doi: 10.4239/wjd.122419
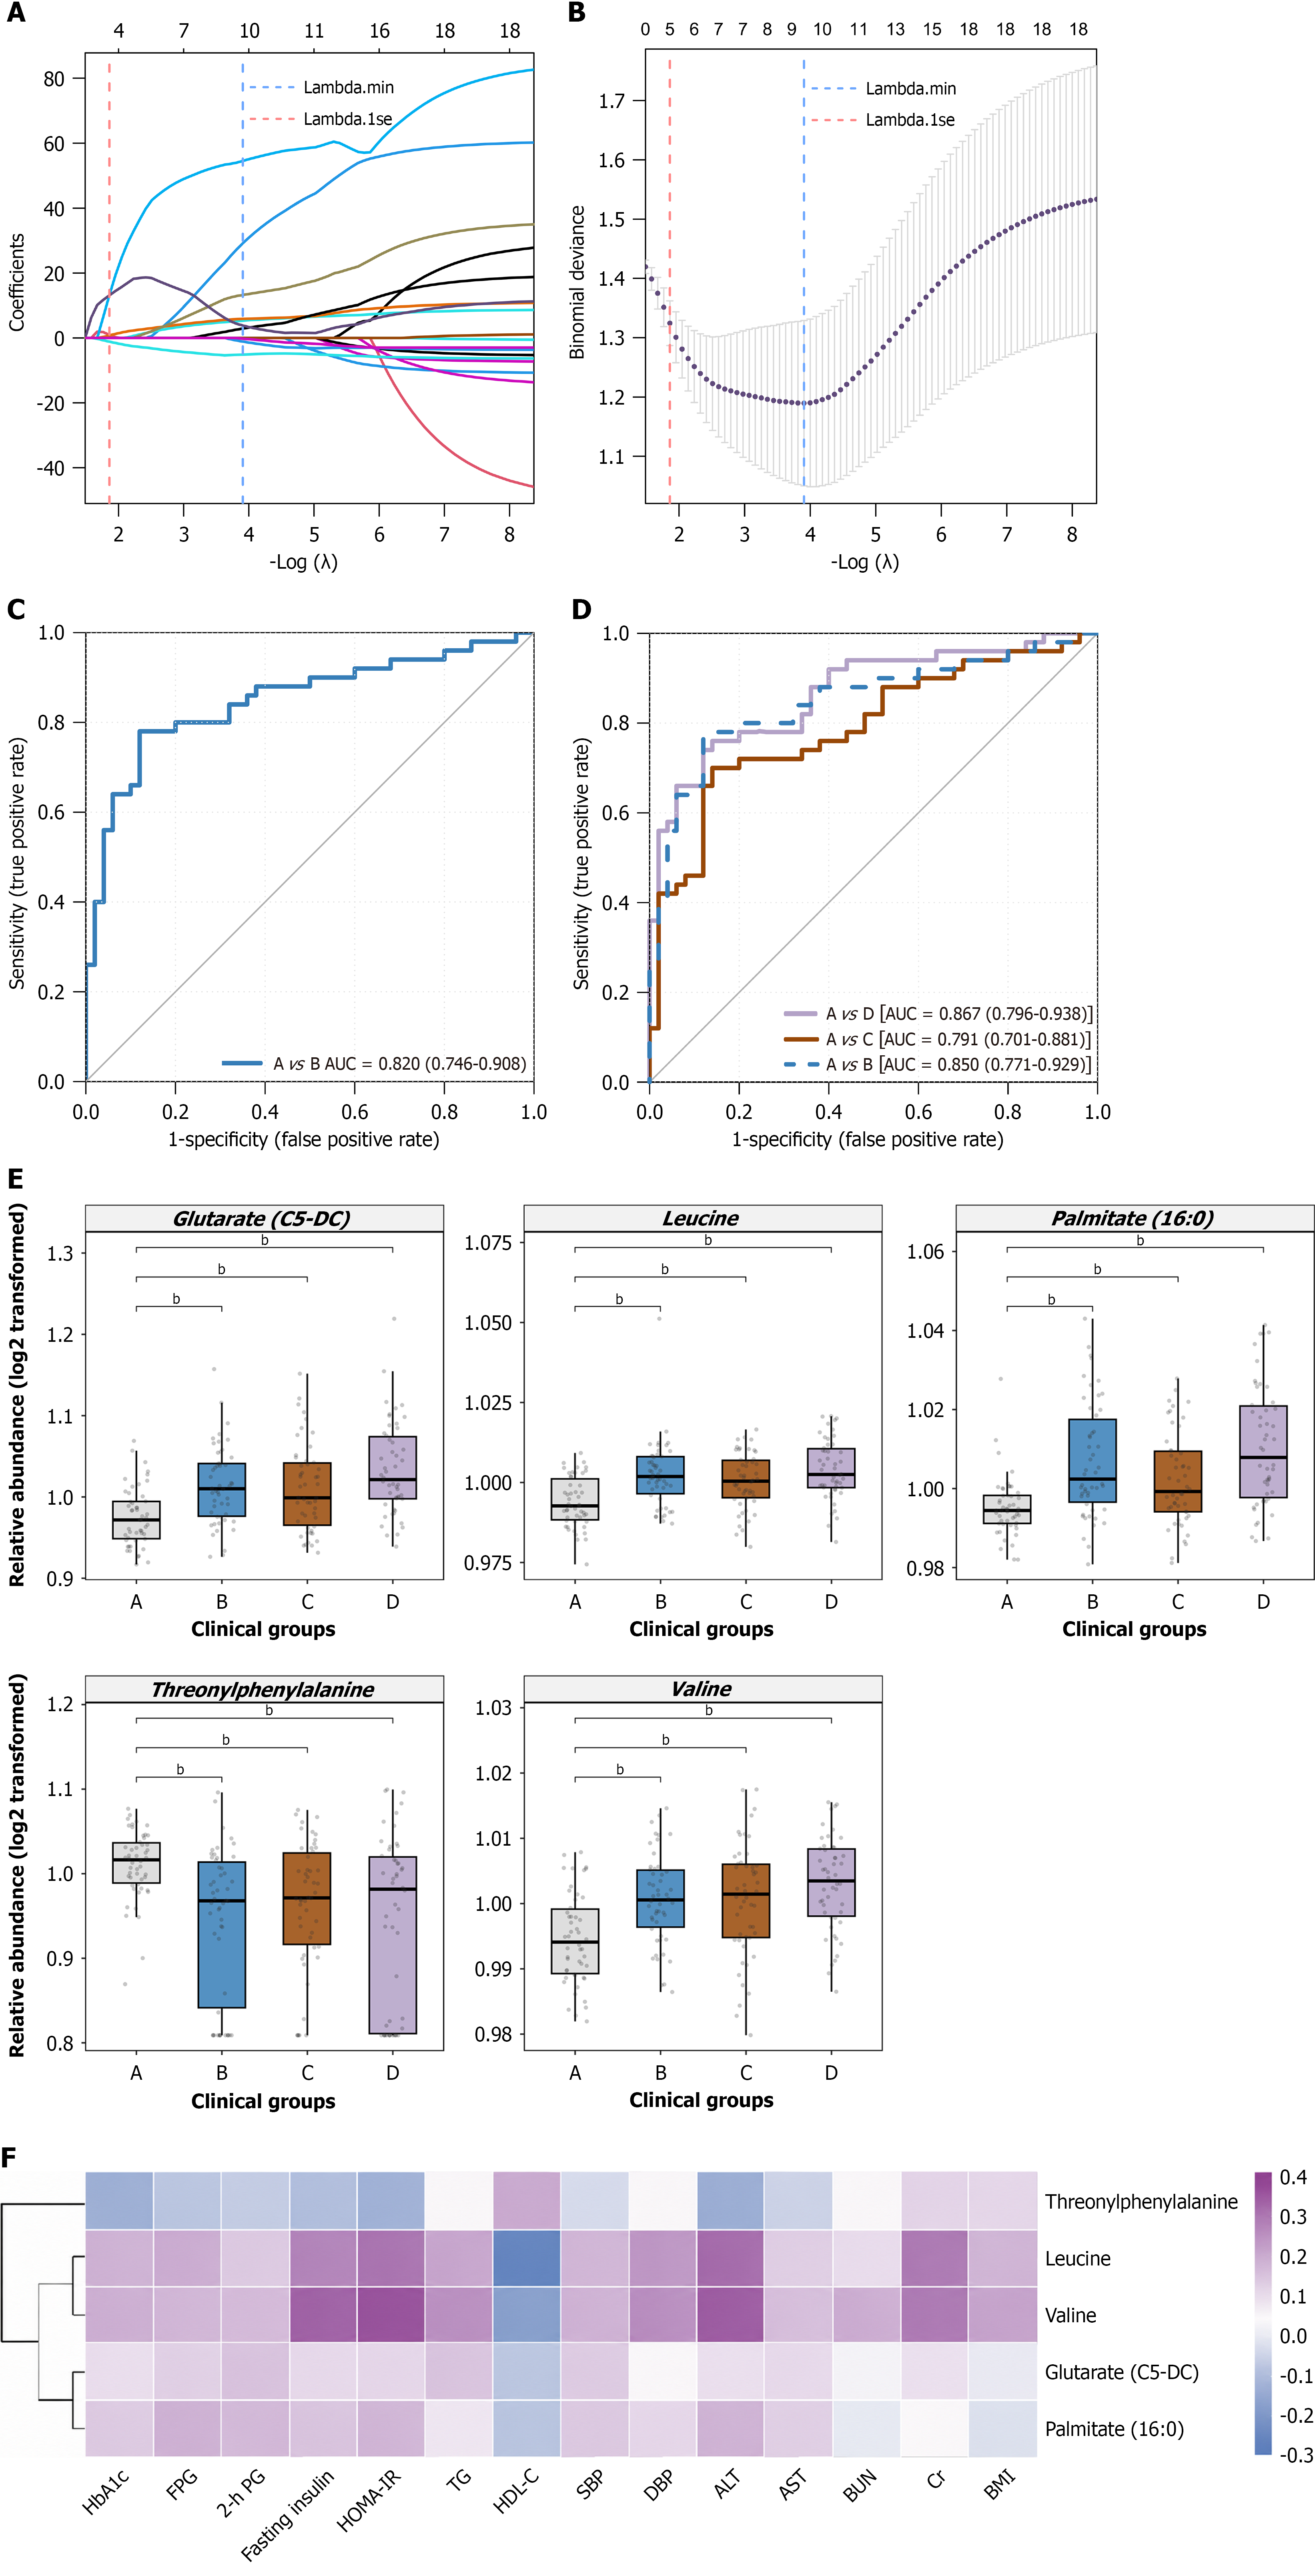
Figure 4 Least absolute shrinkage and selection operator-based selection of candidate discriminative metabolic biomarkers, dis crimination performance, and clinical associations.
A: Least absolute shrinkage and selection operator coefficient profiles of candidate metabolites for discriminating between the normal glucose tolerance (NGT) and impaired fasting glucose (IFG) groups; B: Cross-validation curve of the least absolute shrinkage and selection operator model. The dashed lines indicate the lambda values corresponding to the minimum error criterion (lambda.min) and the 1-SE criterion (lambda.1se), respectively. Based on model parsimony and robustness, lambda.1se was selected to identify the final metabolite panel; C: Receiver operating characteristic curve of the final metabolite panel for discriminating between the NGT and IFG groups, with the optimism-corrected area under the curve shown; D: Receiver operating characteristic curves evaluating the stage-wise discriminative performance of the selected metabolite panel for the comparisons of NGT vs IFG, impaired glucose tolerance, and diabetes; E: Boxplots showing the distribution of the selected metabolites across the NGT, IFG, impaired glucose tolerance, and diabetes groups. bP < 0.01; F: Spearman correlation heatmap showing the associations between the selected metabolites and clinical indicators; color intensity represents Spearman correlation coefficients. AUC: Area under the curve; HbA1c: Glycated hemoglobin; FPG: Fasting plasma glucose; 2-h PG: 2-hour plasma glucose; HOMA-IR: Homeostasis model assessment of insulin resistance; TG: Triglycerides; HDL-C: High-density lipoprotein cholesterol; SBP: Systolic blood pressure; DBP: Diastolic blood pressure; ALT: Alanine aminotransferase; AST: Aspartate aminotransferase; BUN: Blood urea nitrogen; Cr: Creatinine; BMI: Body mass index. A: Normal glucose tolerance; B: Isolated impaired fasting glucose; C: Isolated impaired glucose tolerance; D: Diabetes.
- Citation: Liu YT, Yu LP, Zhu DL, Li ZP, Zhang JP, Xie LD, Song LL, He YF, Jin X, Li ZQ, Deng RF, Zhang C, Zhang B. Plasma metabolomics reveals progressive alterations across glycemic states. World J Diabetes 2026; 17(9): 122419
- URL: https://www.wjgnet.com/1948-9358/full/v17/i9/122419.htm
- DOI: https://dx.doi.org/10.4239/wjd.122419