
















Copyright: ©Author(s) 2026.
World J Diabetes. Sep 15, 2026; 17(9): 122419
Published online Sep 15, 2026. doi: 10.4239/wjd.122419
Published online Sep 15, 2026. doi: 10.4239/wjd.122419
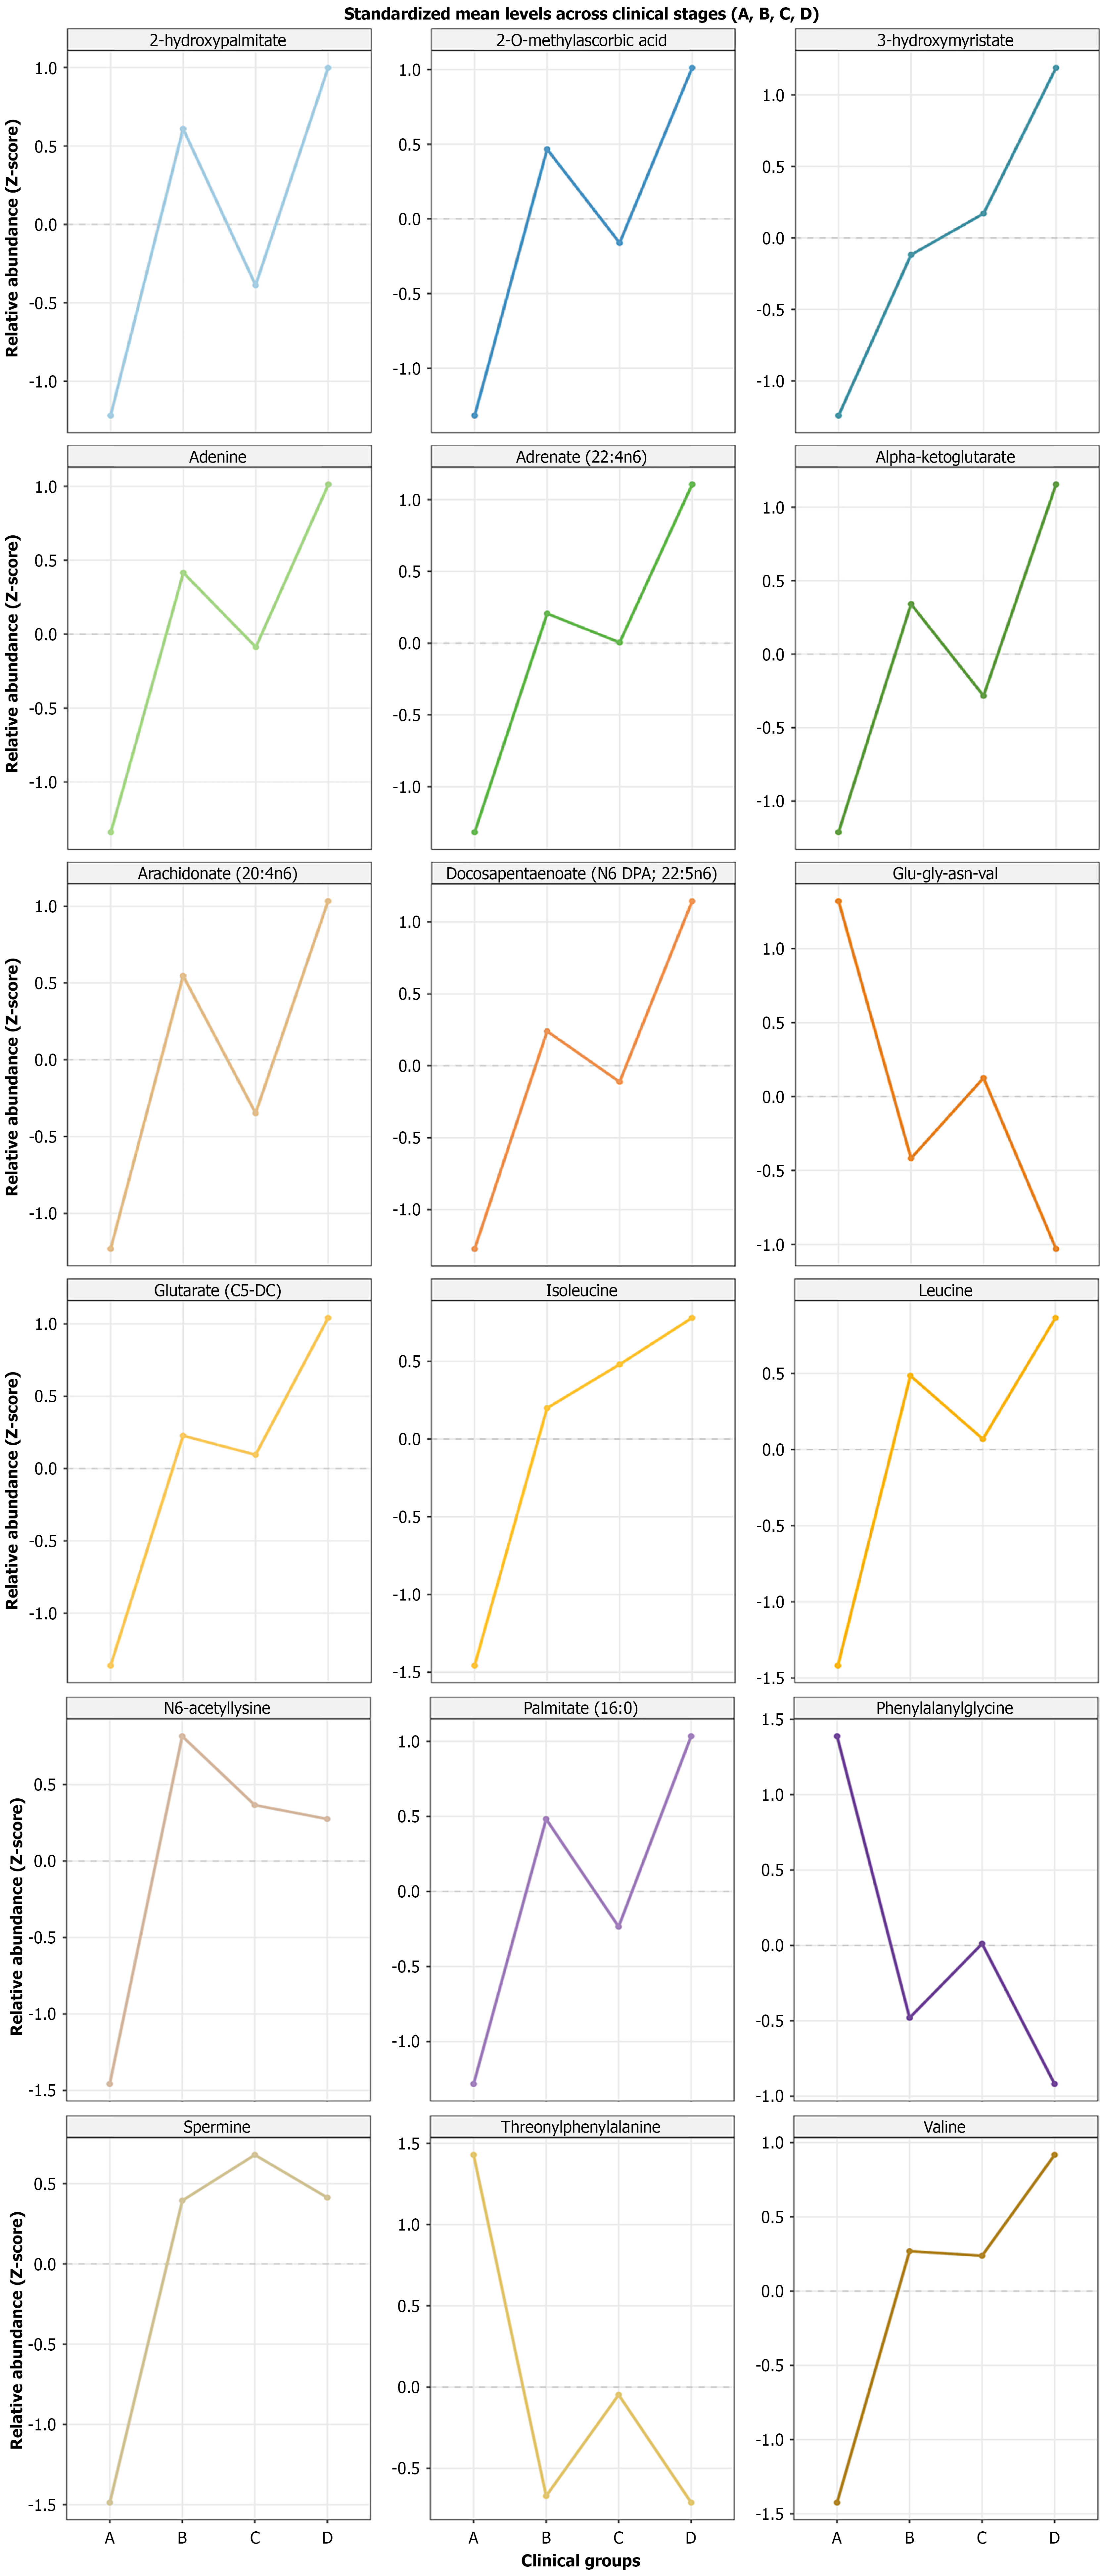
Figure 3 Trajectories of the 18 shared core metabolites across different glycemic states.
Line plots illustrate the standardized relative abundance of the 18 core metabolites across four clinical groups: (1) Normal glucose tolerance; (2) Impaired fasting glucose; (3) Impaired glucose tolerance; and (4) Diabetes. Each panel represents one metabolite, and the data were standardized using Z-score transformation. The X-axis indicates the clinical groups, and the Y-axis indicates the standardized metabolite level. Z-score: Standardized score.
- Citation: Liu YT, Yu LP, Zhu DL, Li ZP, Zhang JP, Xie LD, Song LL, He YF, Jin X, Li ZQ, Deng RF, Zhang C, Zhang B. Plasma metabolomics reveals progressive alterations across glycemic states. World J Diabetes 2026; 17(9): 122419
- URL: https://www.wjgnet.com/1948-9358/full/v17/i9/122419.htm
- DOI: https://dx.doi.org/10.4239/wjd.122419