
















Copyright: ©Author(s) 2026.
World J Diabetes. Aug 15, 2026; 17(8): 122101
Published online Aug 15, 2026. doi: 10.4239/wjd.122101
Published online Aug 15, 2026. doi: 10.4239/wjd.122101
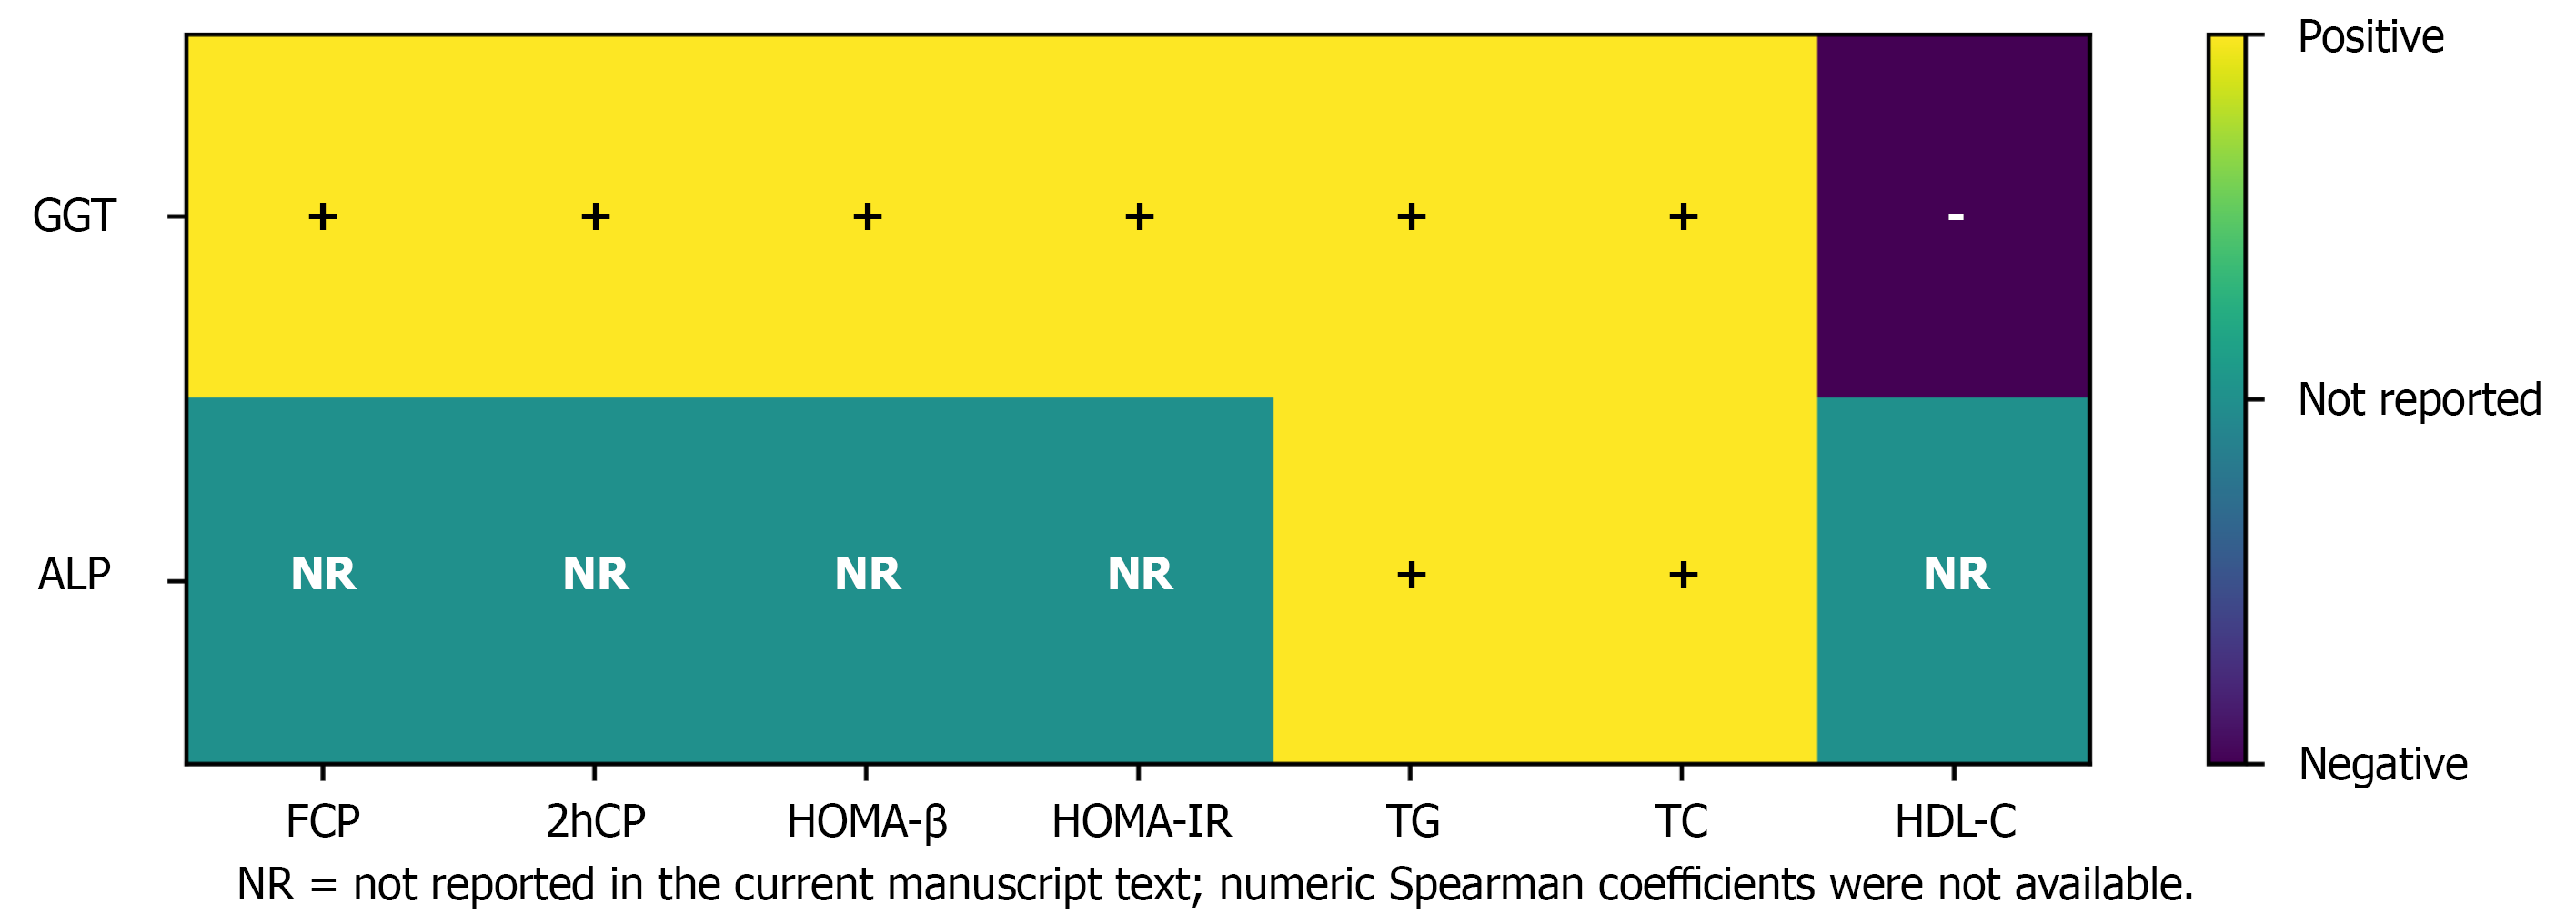
Figure 5 Summary of reported correlations between liver enzymes and metabolic parameters.
The heatmap illustrates the direction of associations between gamma-glutamyl transferase, alkaline phosphatase, and selected metabolic indices. Positive correlations are indicated by “+”, negative correlations by “-”, and “NR” indicates not reported in the current manuscript text. This figure summarizes reported trends rather than quantitative correlation coefficients. GGT: Gamma-glutamyl transferase; ALP: Alkaline phosphatase; FCP: Fasting C-peptide; 2hCP: 2 hours C-peptide; HOMA: Homeostasis model assessment; IR: Insulin resistance; TG: Triglycerides; TC: Total cholesterol; HDL-C: High-density lipoprotein cholesterol; NR: Not reported.
- Citation: Pei SQ, Ren JL, Zhang L, Gao YX, Yang X, Liu X, Li SN, Liu P, Xu XY. Non-antibody biomarkers for differentiating ketosis-onset diabetes: A retrospective study. World J Diabetes 2026; 17(8): 122101
- URL: https://www.wjgnet.com/1948-9358/full/v17/i8/122101.htm
- DOI: https://dx.doi.org/10.4239/wjd.122101