
















Copyright: ©Author(s) 2026.
World J Diabetes. Aug 15, 2026; 17(8): 121505
Published online Aug 15, 2026. doi: 10.4239/wjd.121505
Published online Aug 15, 2026. doi: 10.4239/wjd.121505
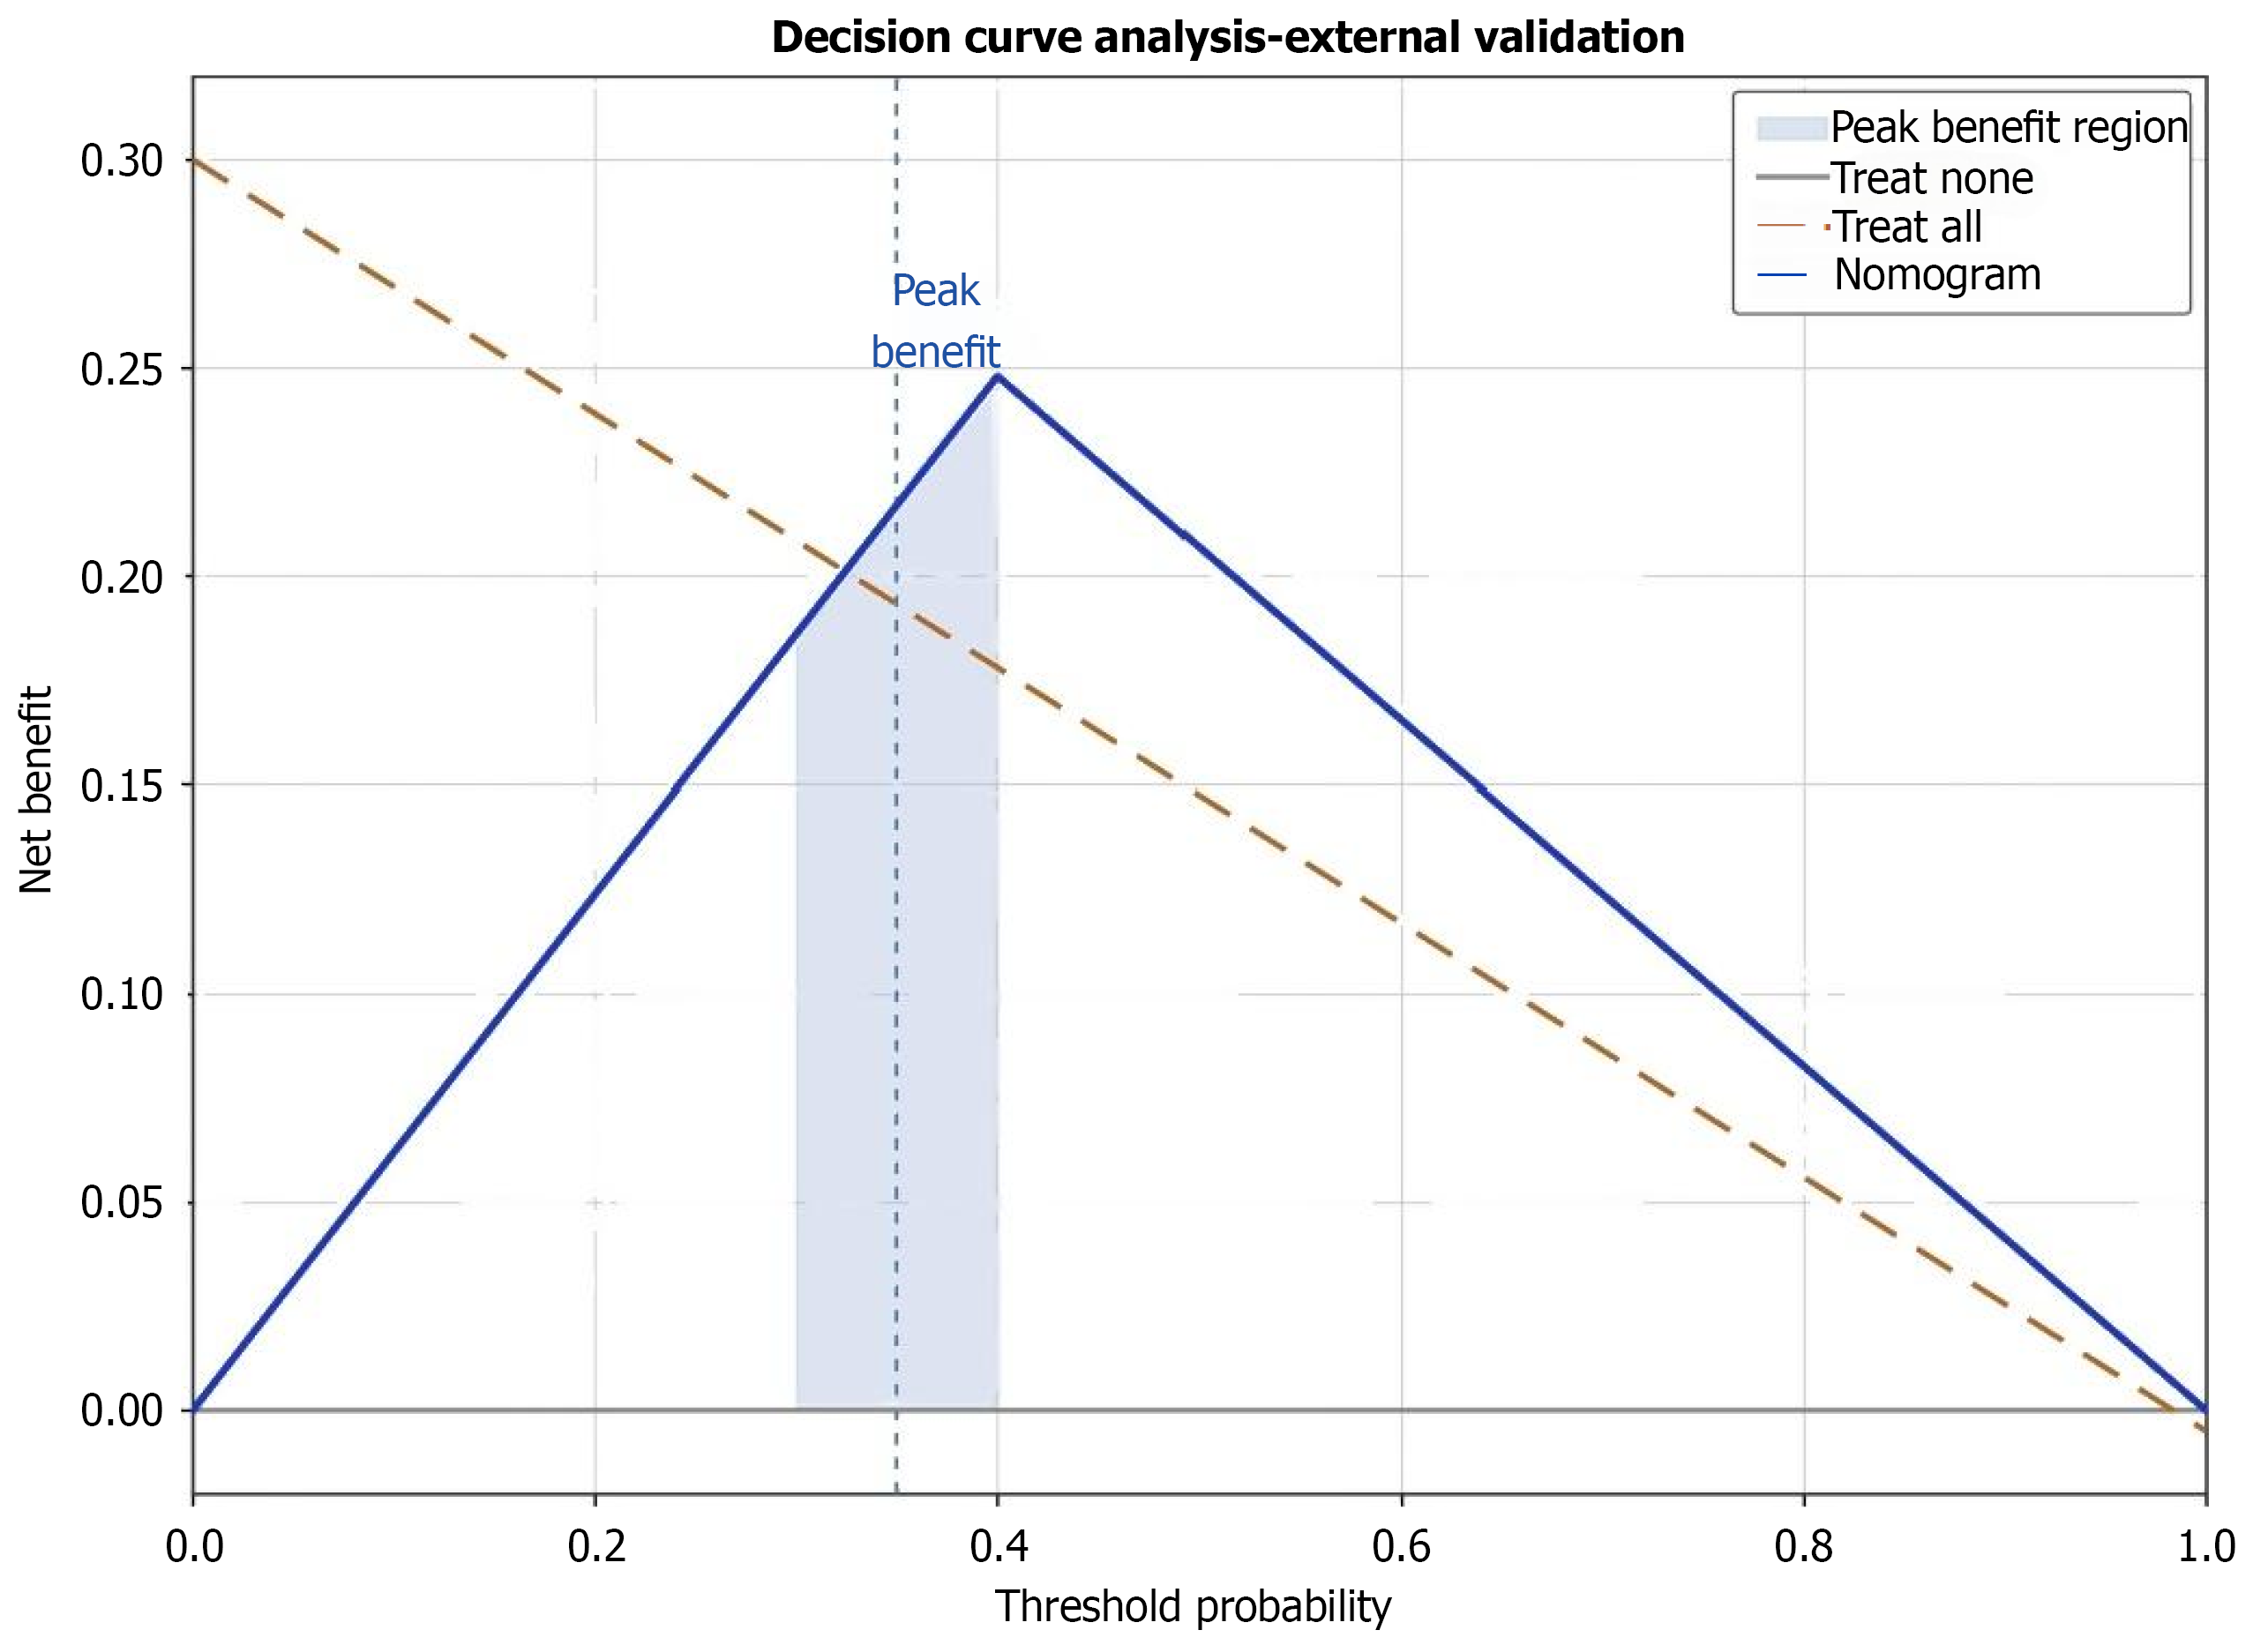
Figure 5 Decision curve analysis - clinical utility of the nomogram.
Decision curve analysis shows the nomogram (blue) provides substantial net benefit compared to uniform strategies (treat all/none) across 10%-80% threshold probabilities, with peak benefit at 30%-40% (light-blue shaded), supporting risk-stratified clinical implementation.
- Citation: Dai BW, Qi F, Xu GY, Sun W, Tao YN, Ze K. Risk stratification nomogram for diabetic foot ulcer recurrence after healing in type 2 diabetes. World J Diabetes 2026; 17(8): 121505
- URL: https://www.wjgnet.com/1948-9358/full/v17/i8/121505.htm
- DOI: https://dx.doi.org/10.4239/wjd.121505