
















Copyright: ©Author(s) 2026.
World J Diabetes. Aug 15, 2026; 17(8): 121505
Published online Aug 15, 2026. doi: 10.4239/wjd.121505
Published online Aug 15, 2026. doi: 10.4239/wjd.121505
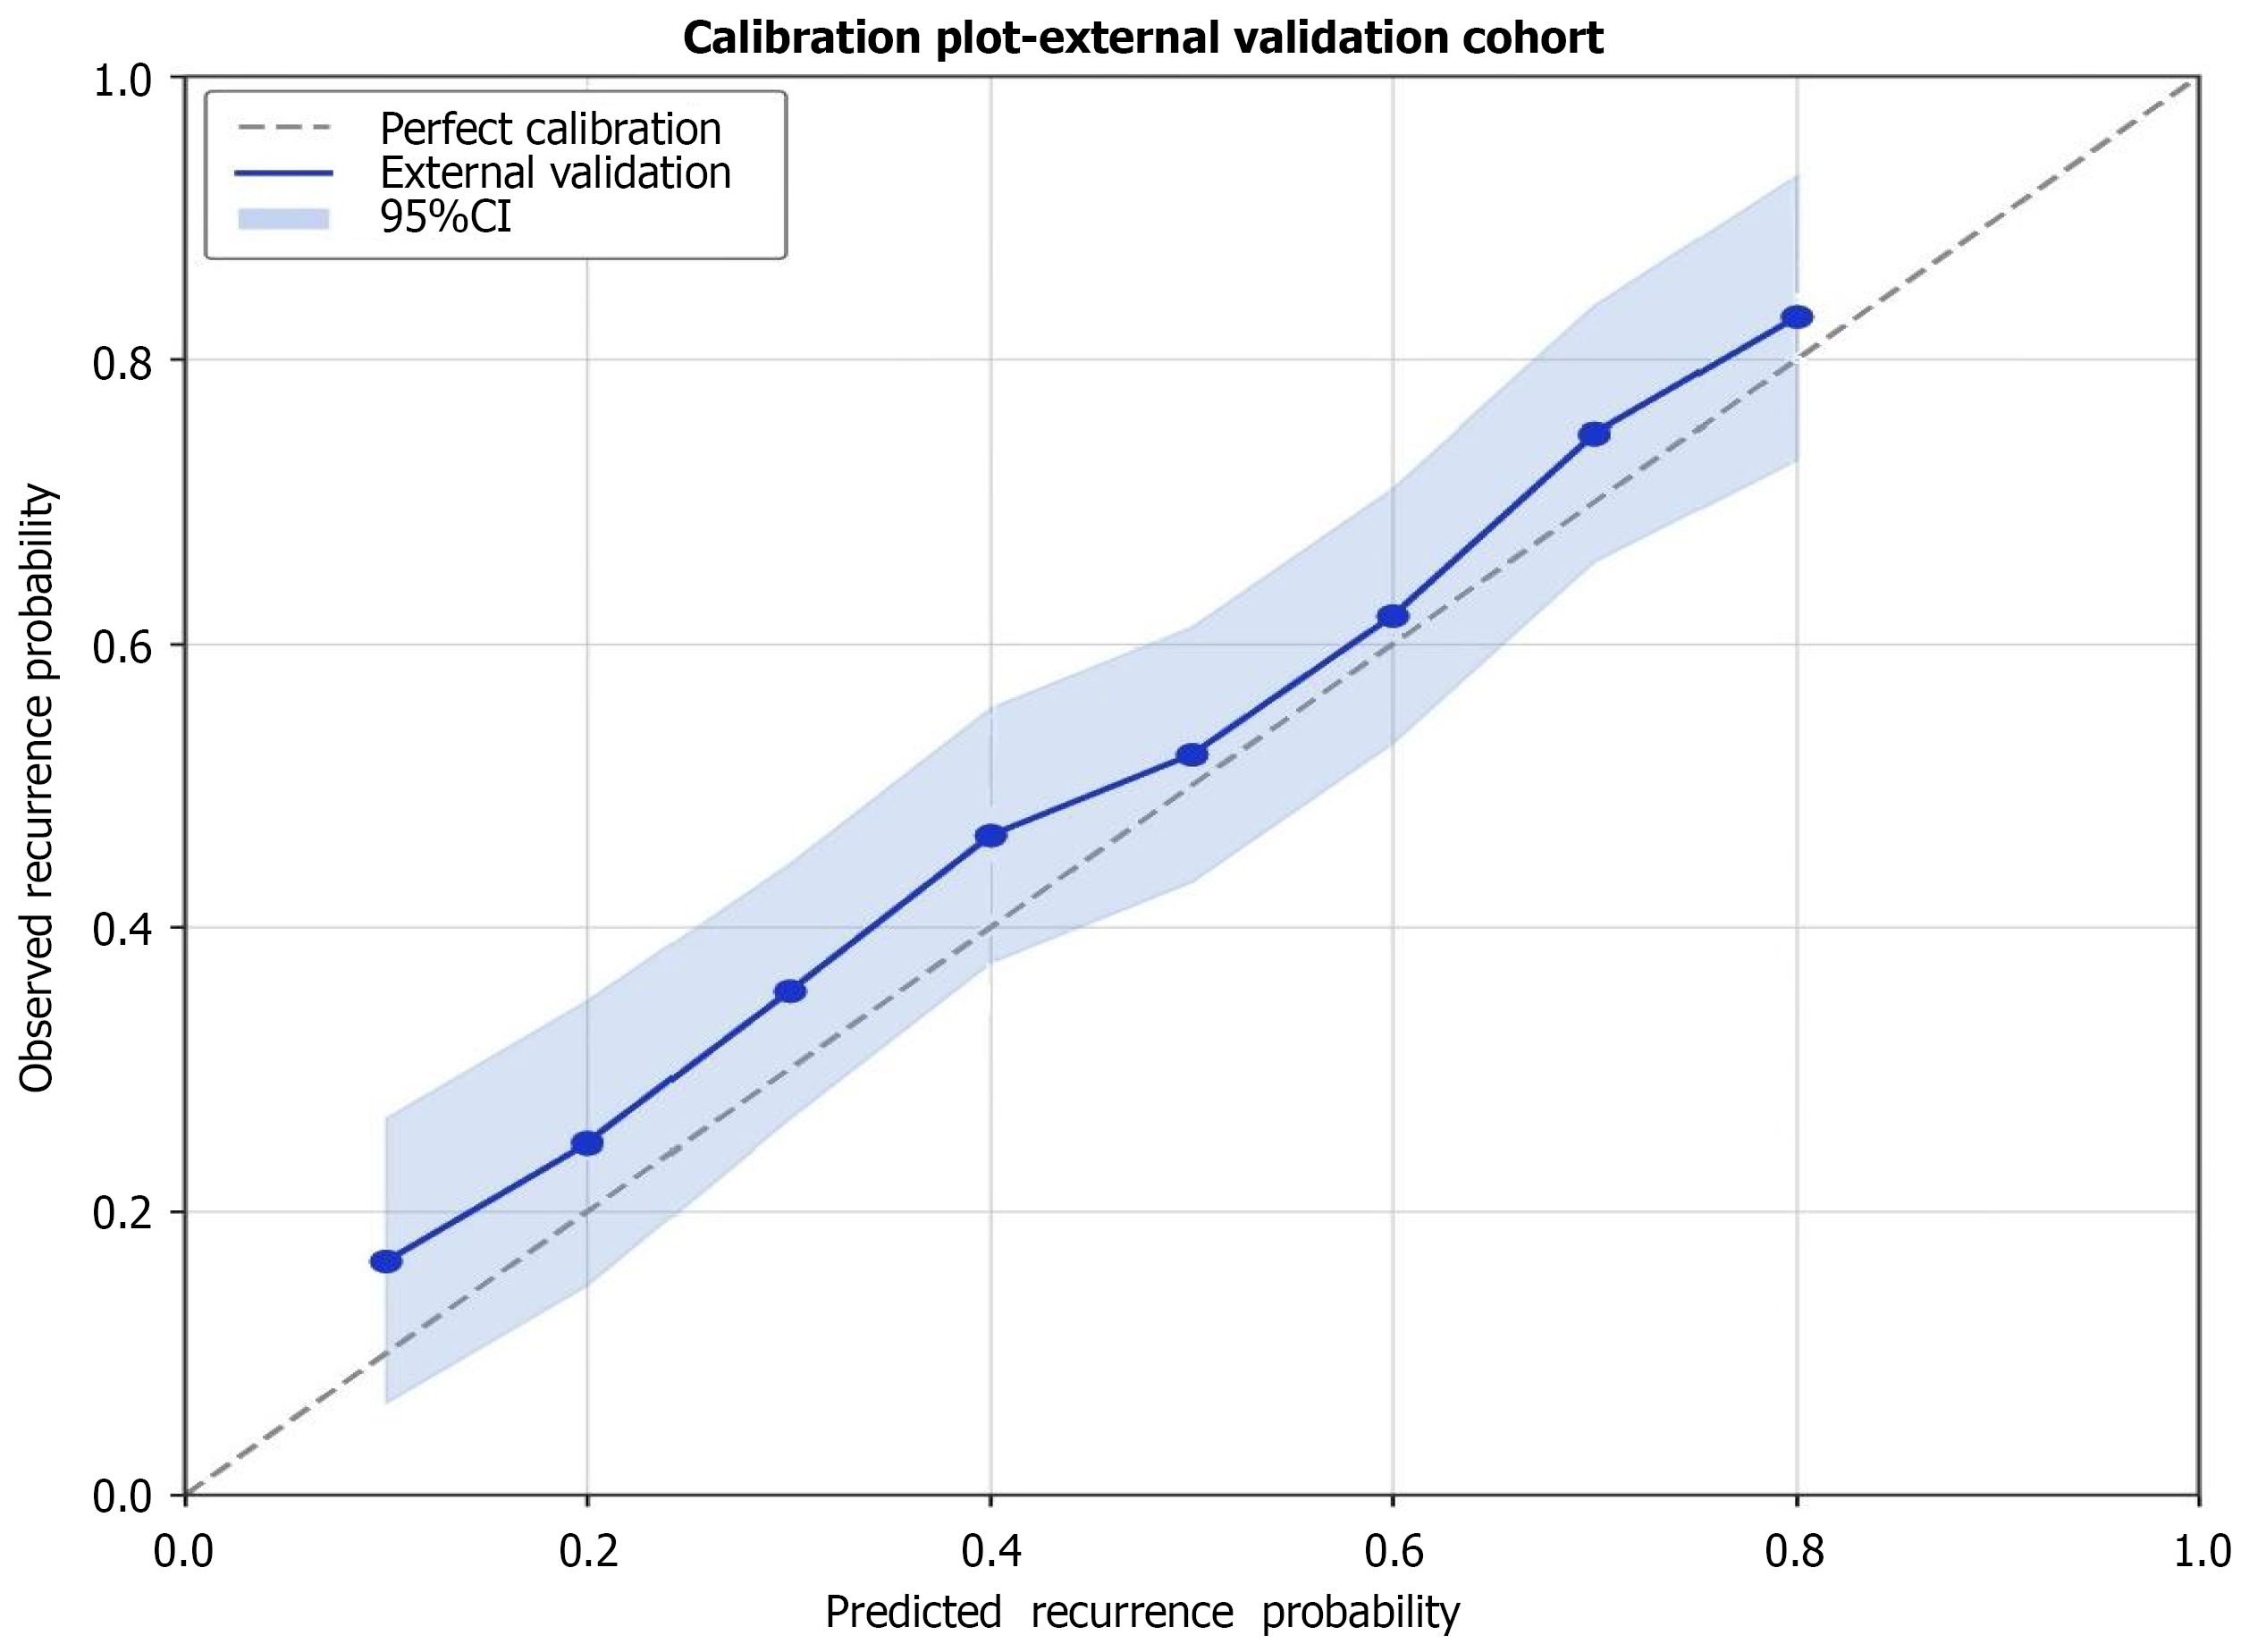
Figure 3 Temporal validation calibration plot.
The calibration plot shows close agreement between predicted and observed 2-year recurrence probabilities in the temporal validation cohort. Observed rates (blue circles) align well with the line of perfect calibration (dashed line), with calibration slope of 0.94 and intercept of 0.06, confirming excellent model calibration across the risk spectrum. CI: Confidence interval.
- Citation: Dai BW, Qi F, Xu GY, Sun W, Tao YN, Ze K. Risk stratification nomogram for diabetic foot ulcer recurrence after healing in type 2 diabetes. World J Diabetes 2026; 17(8): 121505
- URL: https://www.wjgnet.com/1948-9358/full/v17/i8/121505.htm
- DOI: https://dx.doi.org/10.4239/wjd.121505