
















Copyright: ©Author(s) 2026.
World J Diabetes. Aug 15, 2026; 17(8): 121422
Published online Aug 15, 2026. doi: 10.4239/wjd.121422
Published online Aug 15, 2026. doi: 10.4239/wjd.121422
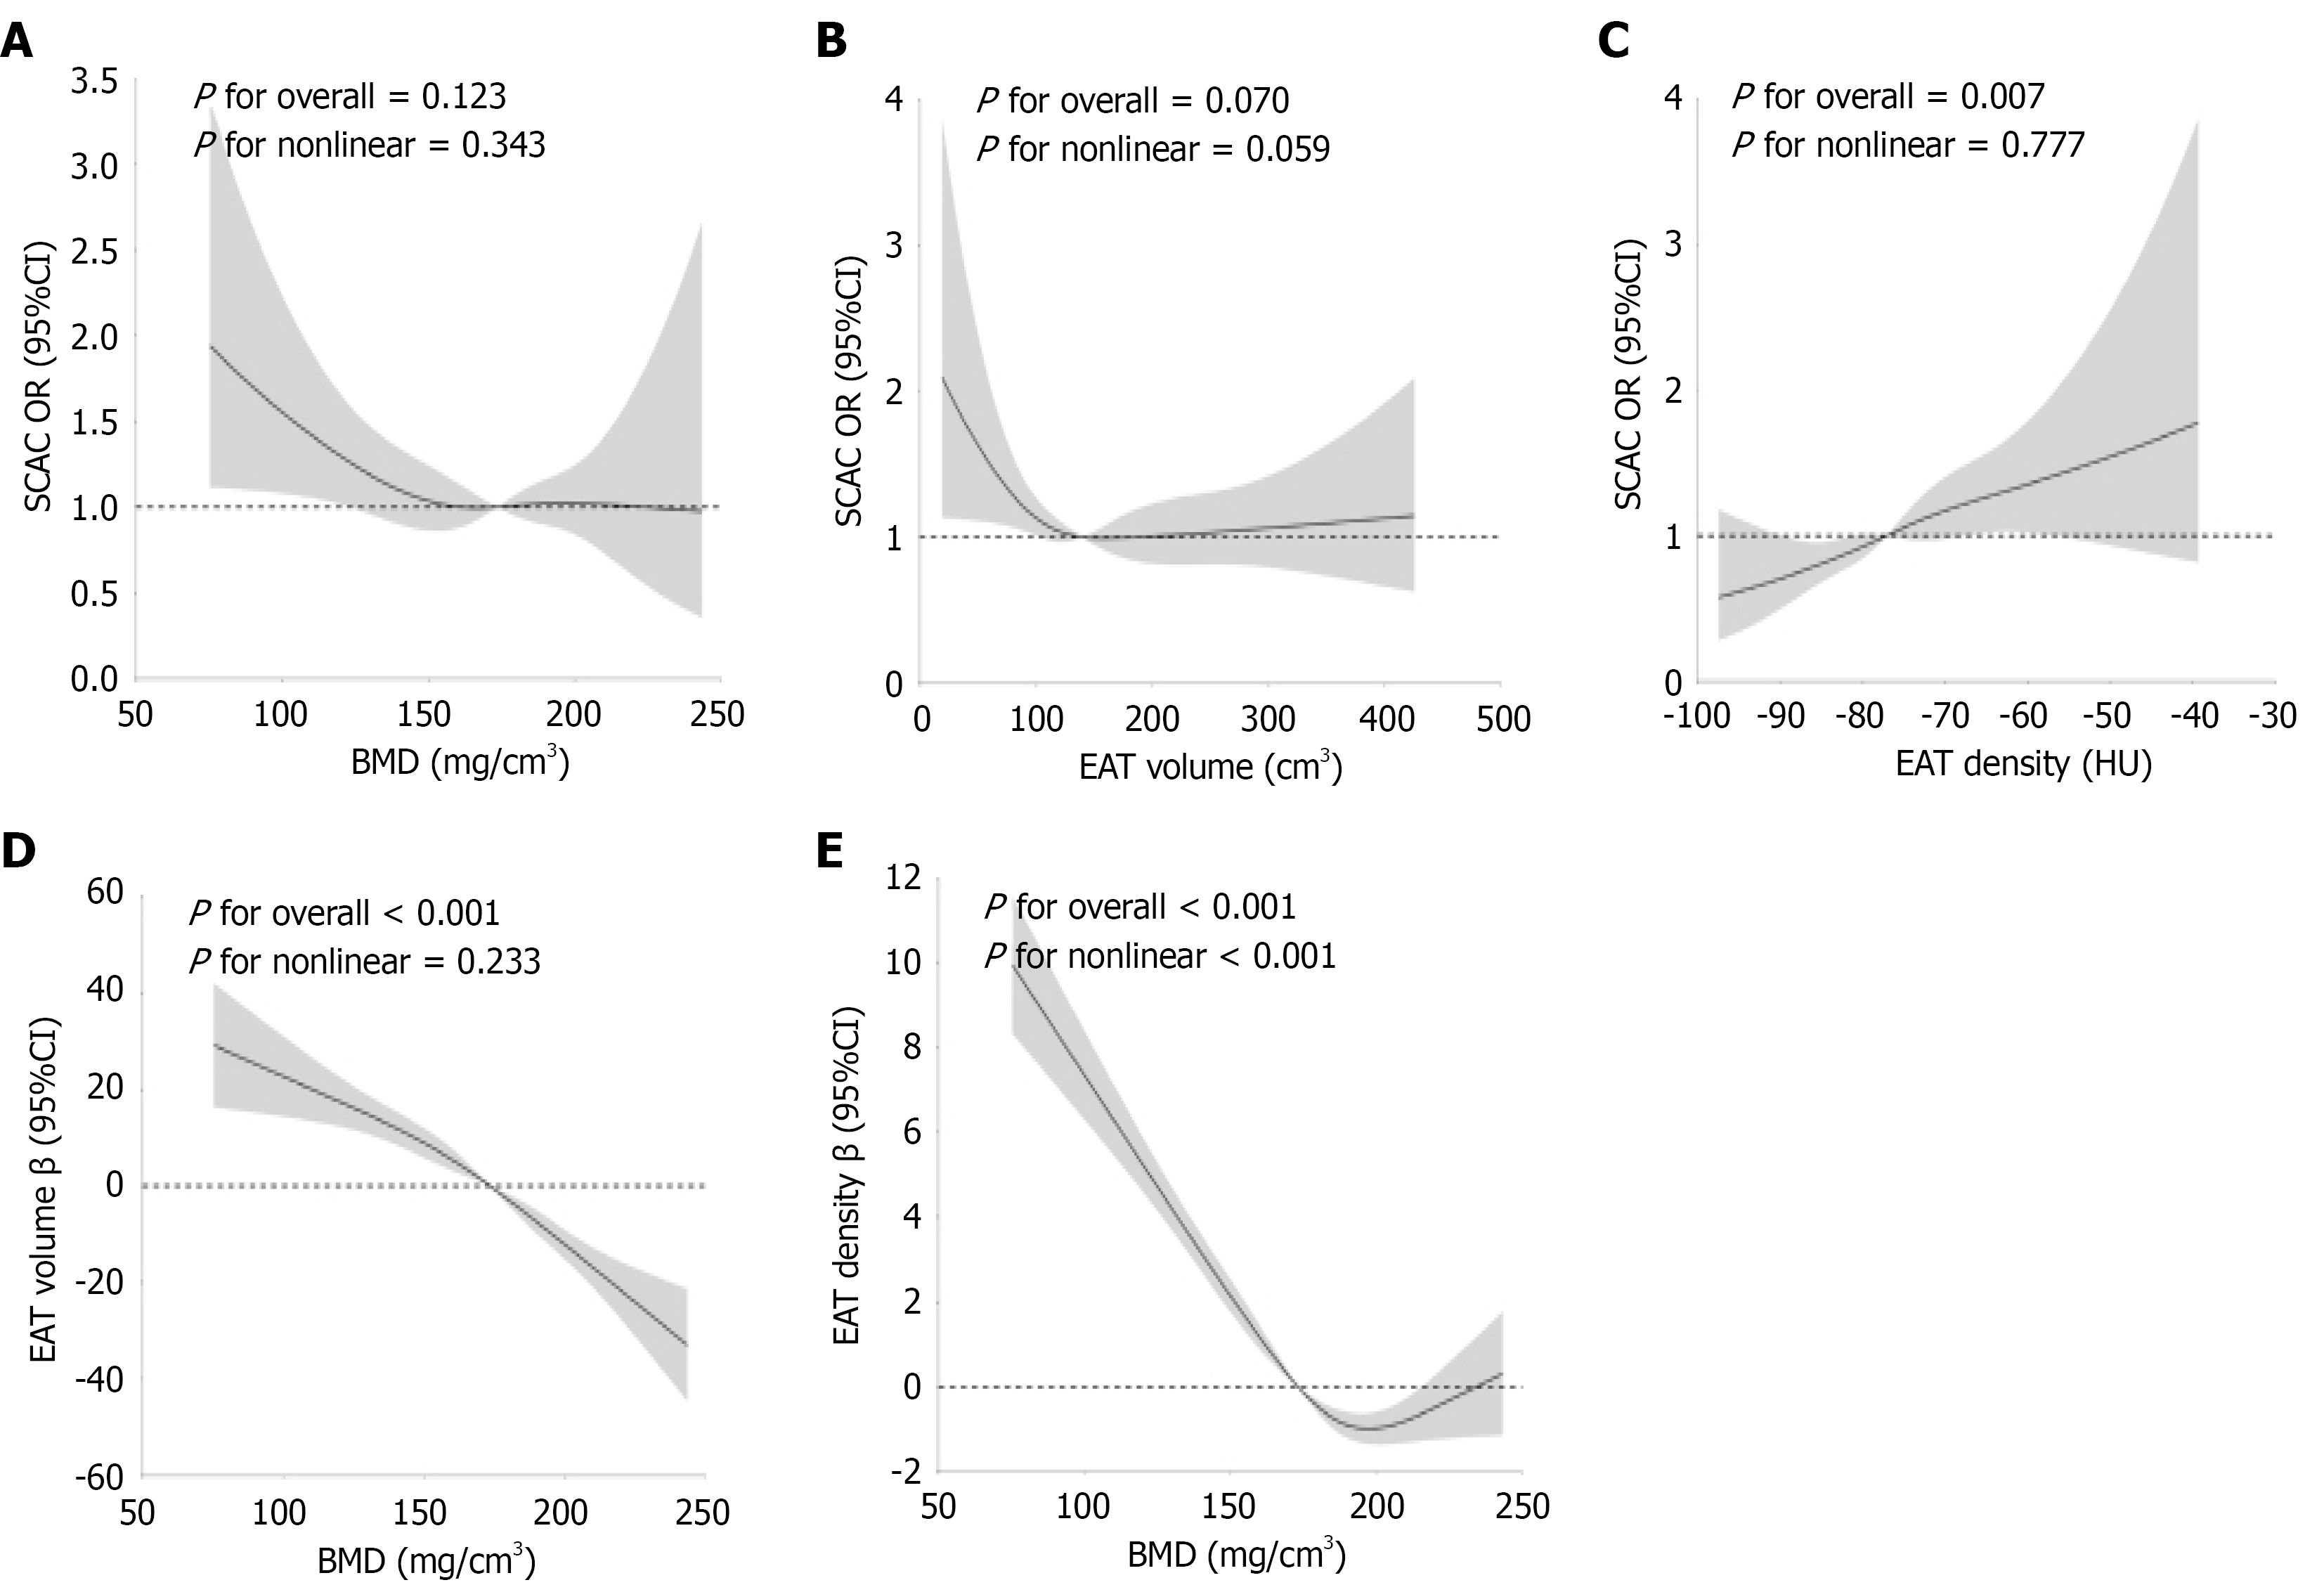
Figure 4 Restricted cubic spline analyses of the associations between computed tomography-derived imaging biomarkers.
The β coefficients and odds ratios are represented by solid lines, and the 95%CIs are indicated by shaded areas. Knots were positioned at the 5%, 35%, 65%, and 95% of each distribution. A: Bone mineral density (BMD) and severe coronary artery calcification (SCAC); B: Epicardial adipose tissue (EAT) volume and SCAC; C: EAT density and SCAC; D: BMD and EAT volume; E: BMD and EAT density. SCAC: Severe coronary artery calcification; BMD: Bone mineral density; EAT: Epicardial adipose tissue; OR: Odds ratio.
- Citation: Liu YK, Wu FY, Jiang CP, Xia YX, Li Y, Zeng WW, Zhang SY, Fan DN, Zhang MX, Liu TC, Wu XP, Dong Y, Chen W, Zhao YH, Li T, Li Z, Xu XY. Artificial intelligence-based chest computed tomography assessment of bone, vascular, and epicardial adipose changes in type 2 diabetes. World J Diabetes 2026; 17(8): 121422
- URL: https://www.wjgnet.com/1948-9358/full/v17/i8/121422.htm
- DOI: https://dx.doi.org/10.4239/wjd.121422