
















Copyright: ©Author(s) 2026.
World J Diabetes. Aug 15, 2026; 17(8): 121422
Published online Aug 15, 2026. doi: 10.4239/wjd.121422
Published online Aug 15, 2026. doi: 10.4239/wjd.121422
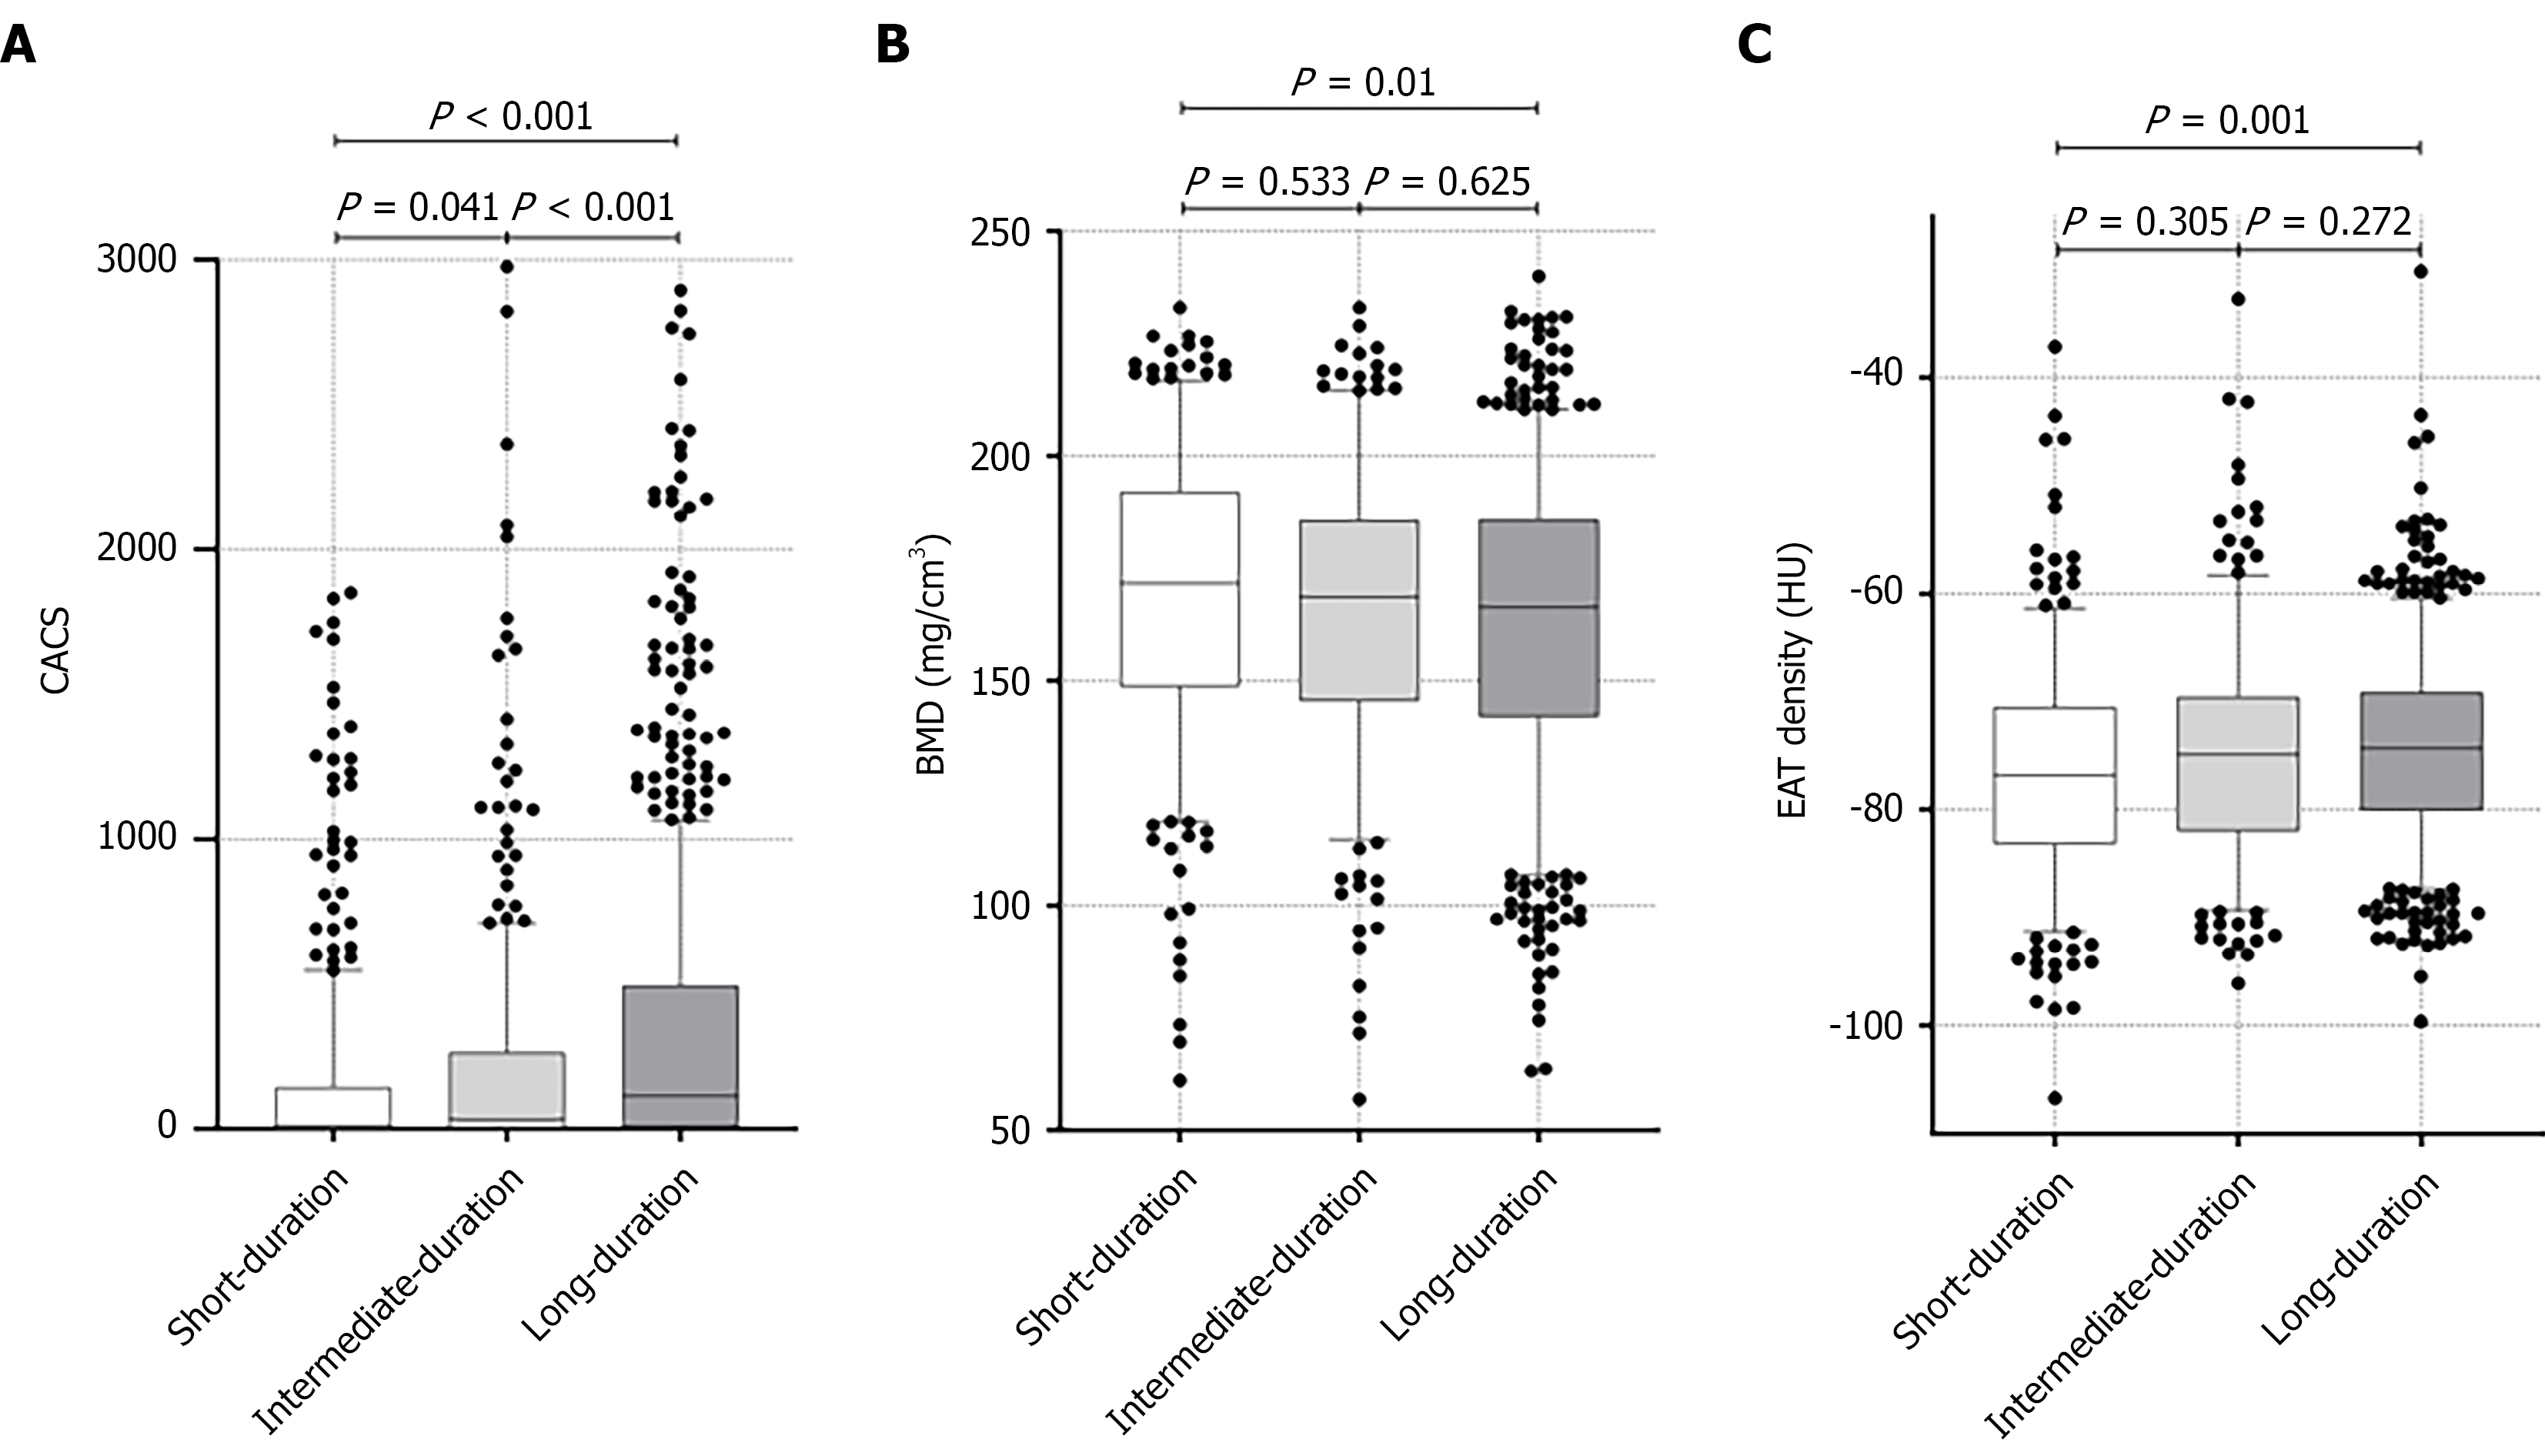
Figure 3 Comparison of bone mineral density, severe coronary artery calcification, and epicardial adipose tissue density among type 2 diabetes mellitus patients with different durations.
A: Severe coronary artery calcification; B: Bone mineral density; C: Epicardial adipose tissue. Data are presented as the median (interquartile range). Comparisons among the three groups were performed using one-way analysis of variance, with P values indicated at the top of each panel. SCAC: Severe coronary artery calcification; BMD: Bone mineral density; EAT: Epicardial adipose tissue; HU: Hounsfield unit.
- Citation: Liu YK, Wu FY, Jiang CP, Xia YX, Li Y, Zeng WW, Zhang SY, Fan DN, Zhang MX, Liu TC, Wu XP, Dong Y, Chen W, Zhao YH, Li T, Li Z, Xu XY. Artificial intelligence-based chest computed tomography assessment of bone, vascular, and epicardial adipose changes in type 2 diabetes. World J Diabetes 2026; 17(8): 121422
- URL: https://www.wjgnet.com/1948-9358/full/v17/i8/121422.htm
- DOI: https://dx.doi.org/10.4239/wjd.121422