
















Copyright: ©Author(s) 2026.
World J Diabetes. Aug 15, 2026; 17(8): 121165
Published online Aug 15, 2026. doi: 10.4239/wjd.121165
Published online Aug 15, 2026. doi: 10.4239/wjd.121165
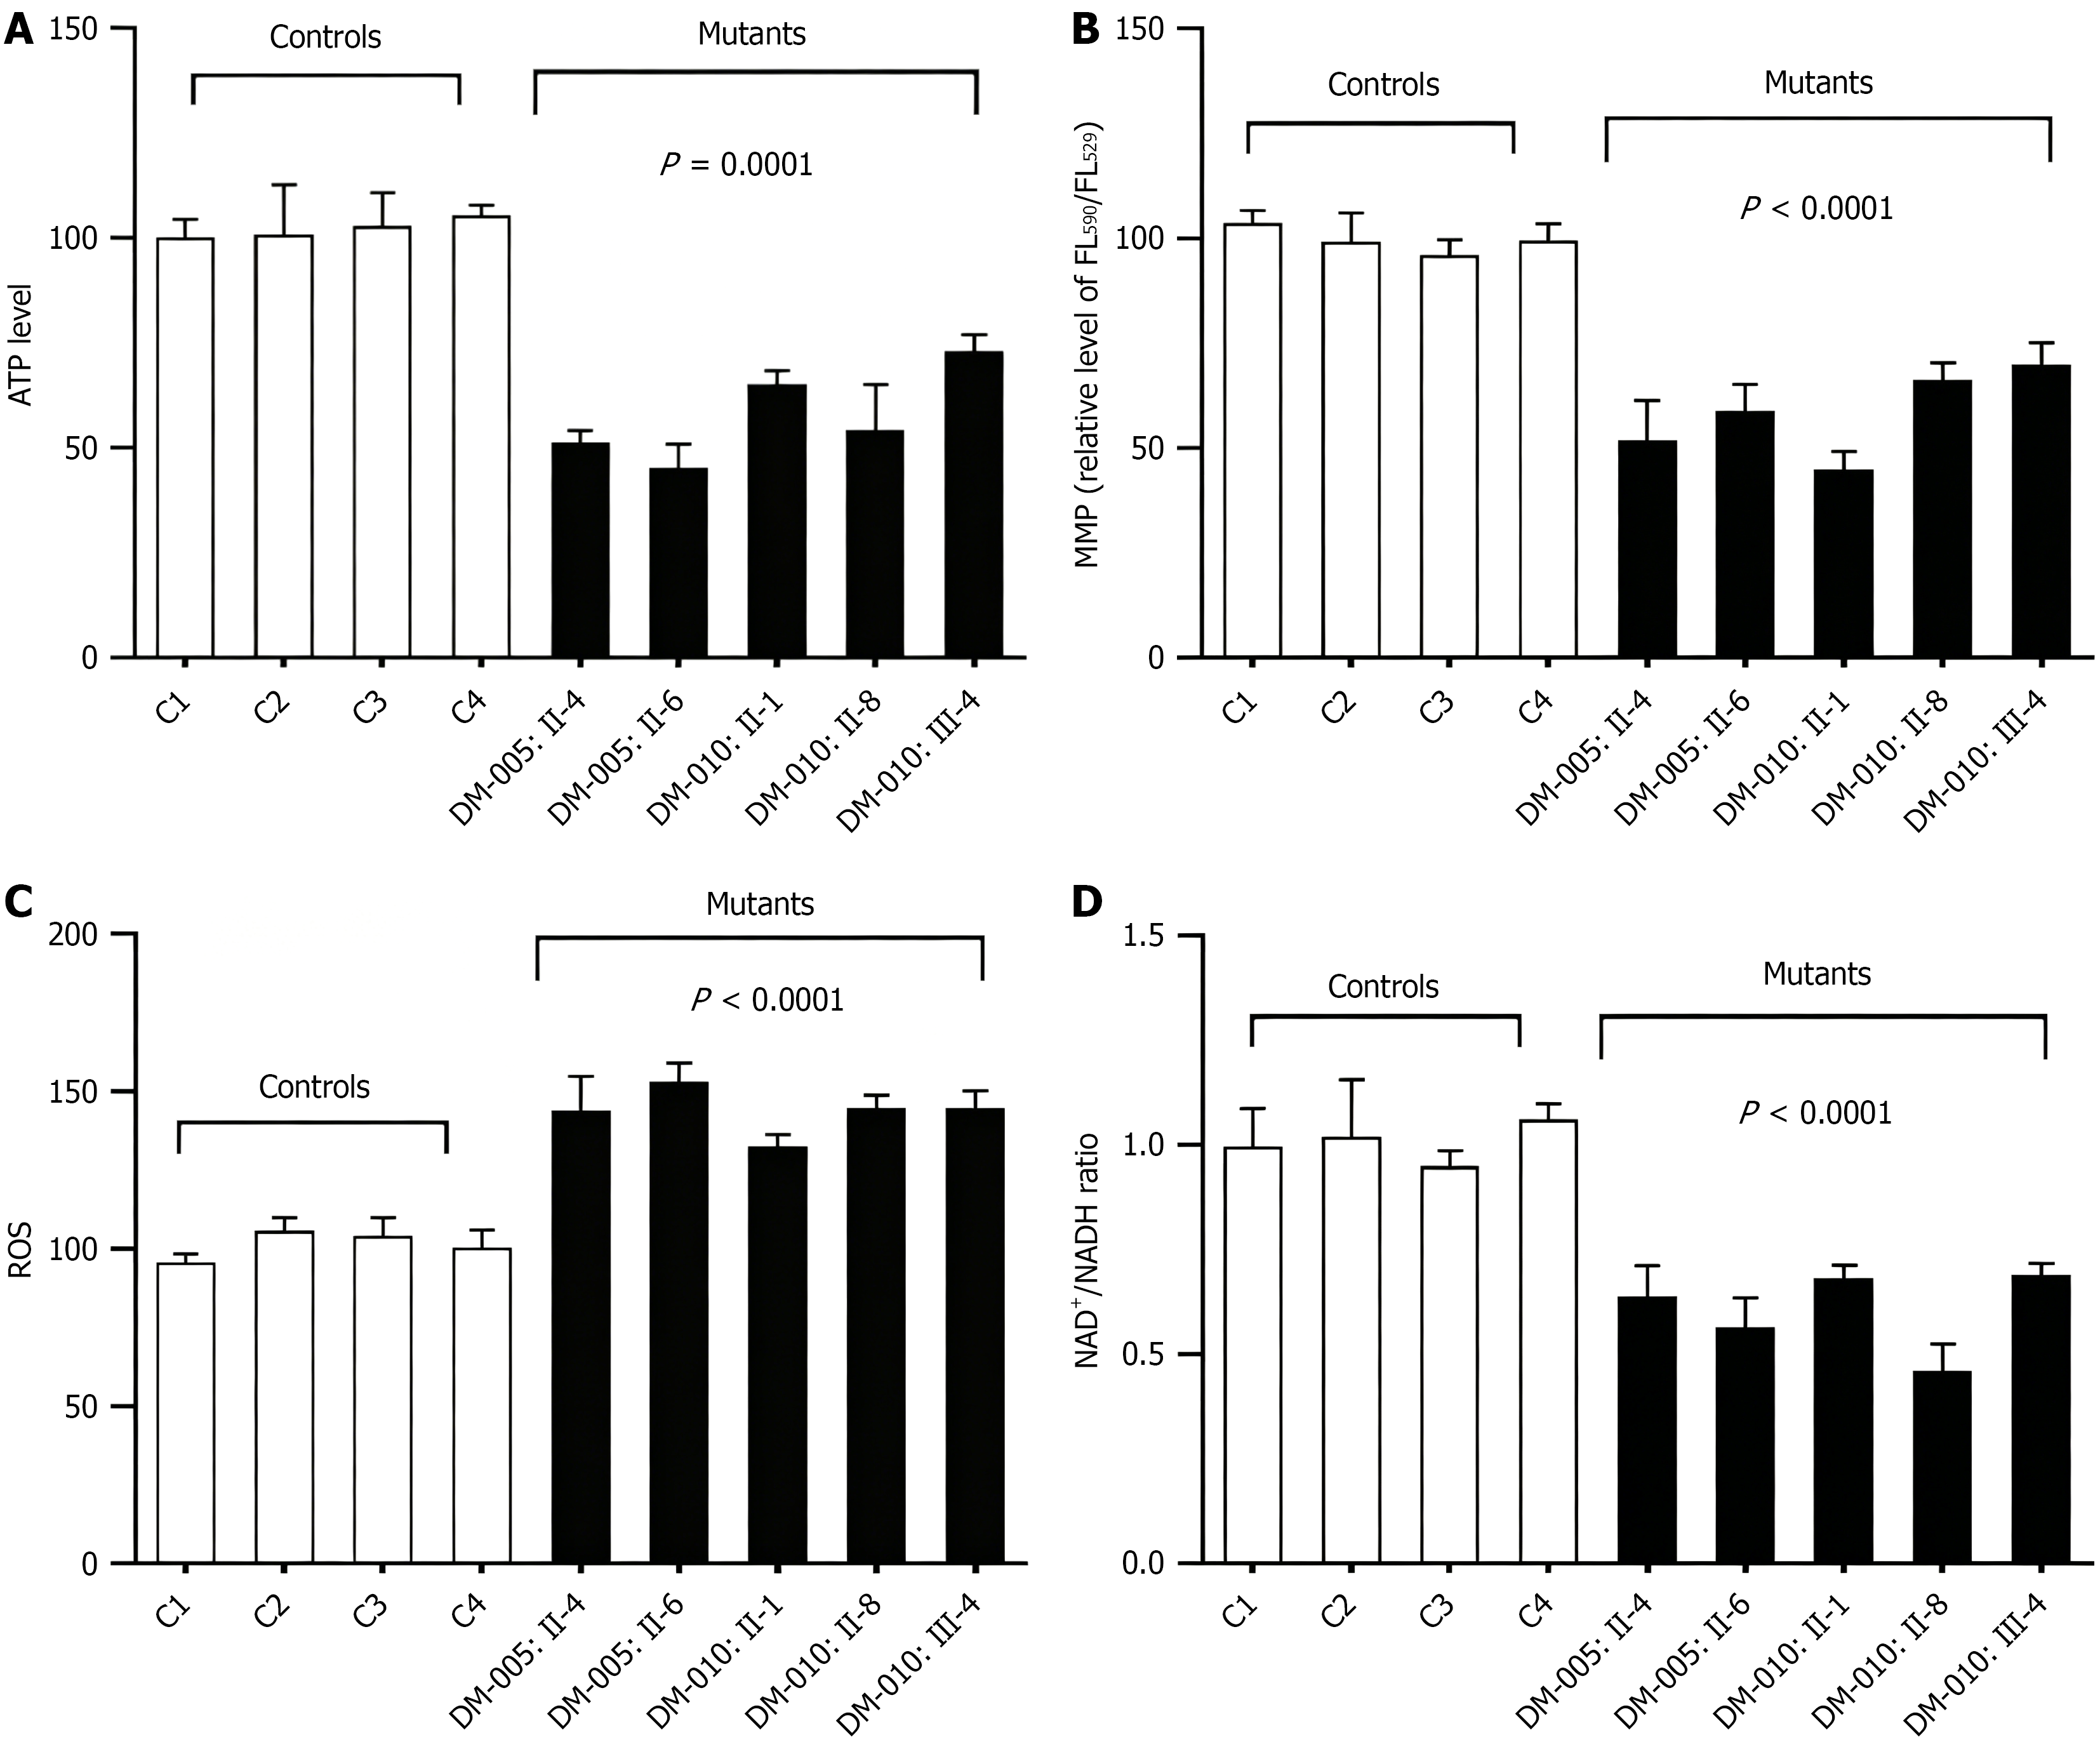
Figure 4 Assessment of mitochondrial functions in mutant and control cybrid cell lines.
A: Adenosine triphosphate production; B: Mitochondrial membrane potential; C: Reactive oxygen species levels; D: NAD+/NADH ratio. ATP: Adenosine triphosphate; DM: Diabetes mellitus; MMP: Mitochondrial membrane potential; ROS: Reactive oxygen species.
- Citation: Yu XJ, Ding Y. Maternally inherited type 2 diabetes mellitus may be associated with mitochondrial tRNAThr mutations. World J Diabetes 2026; 17(8): 121165
- URL: https://www.wjgnet.com/1948-9358/full/v17/i8/121165.htm
- DOI: https://dx.doi.org/10.4239/wjd.121165