
















Copyright: ©Author(s) 2026.
World J Diabetes. Aug 15, 2026; 17(8): 113938
Published online Aug 15, 2026. doi: 10.4239/wjd.113938
Published online Aug 15, 2026. doi: 10.4239/wjd.113938
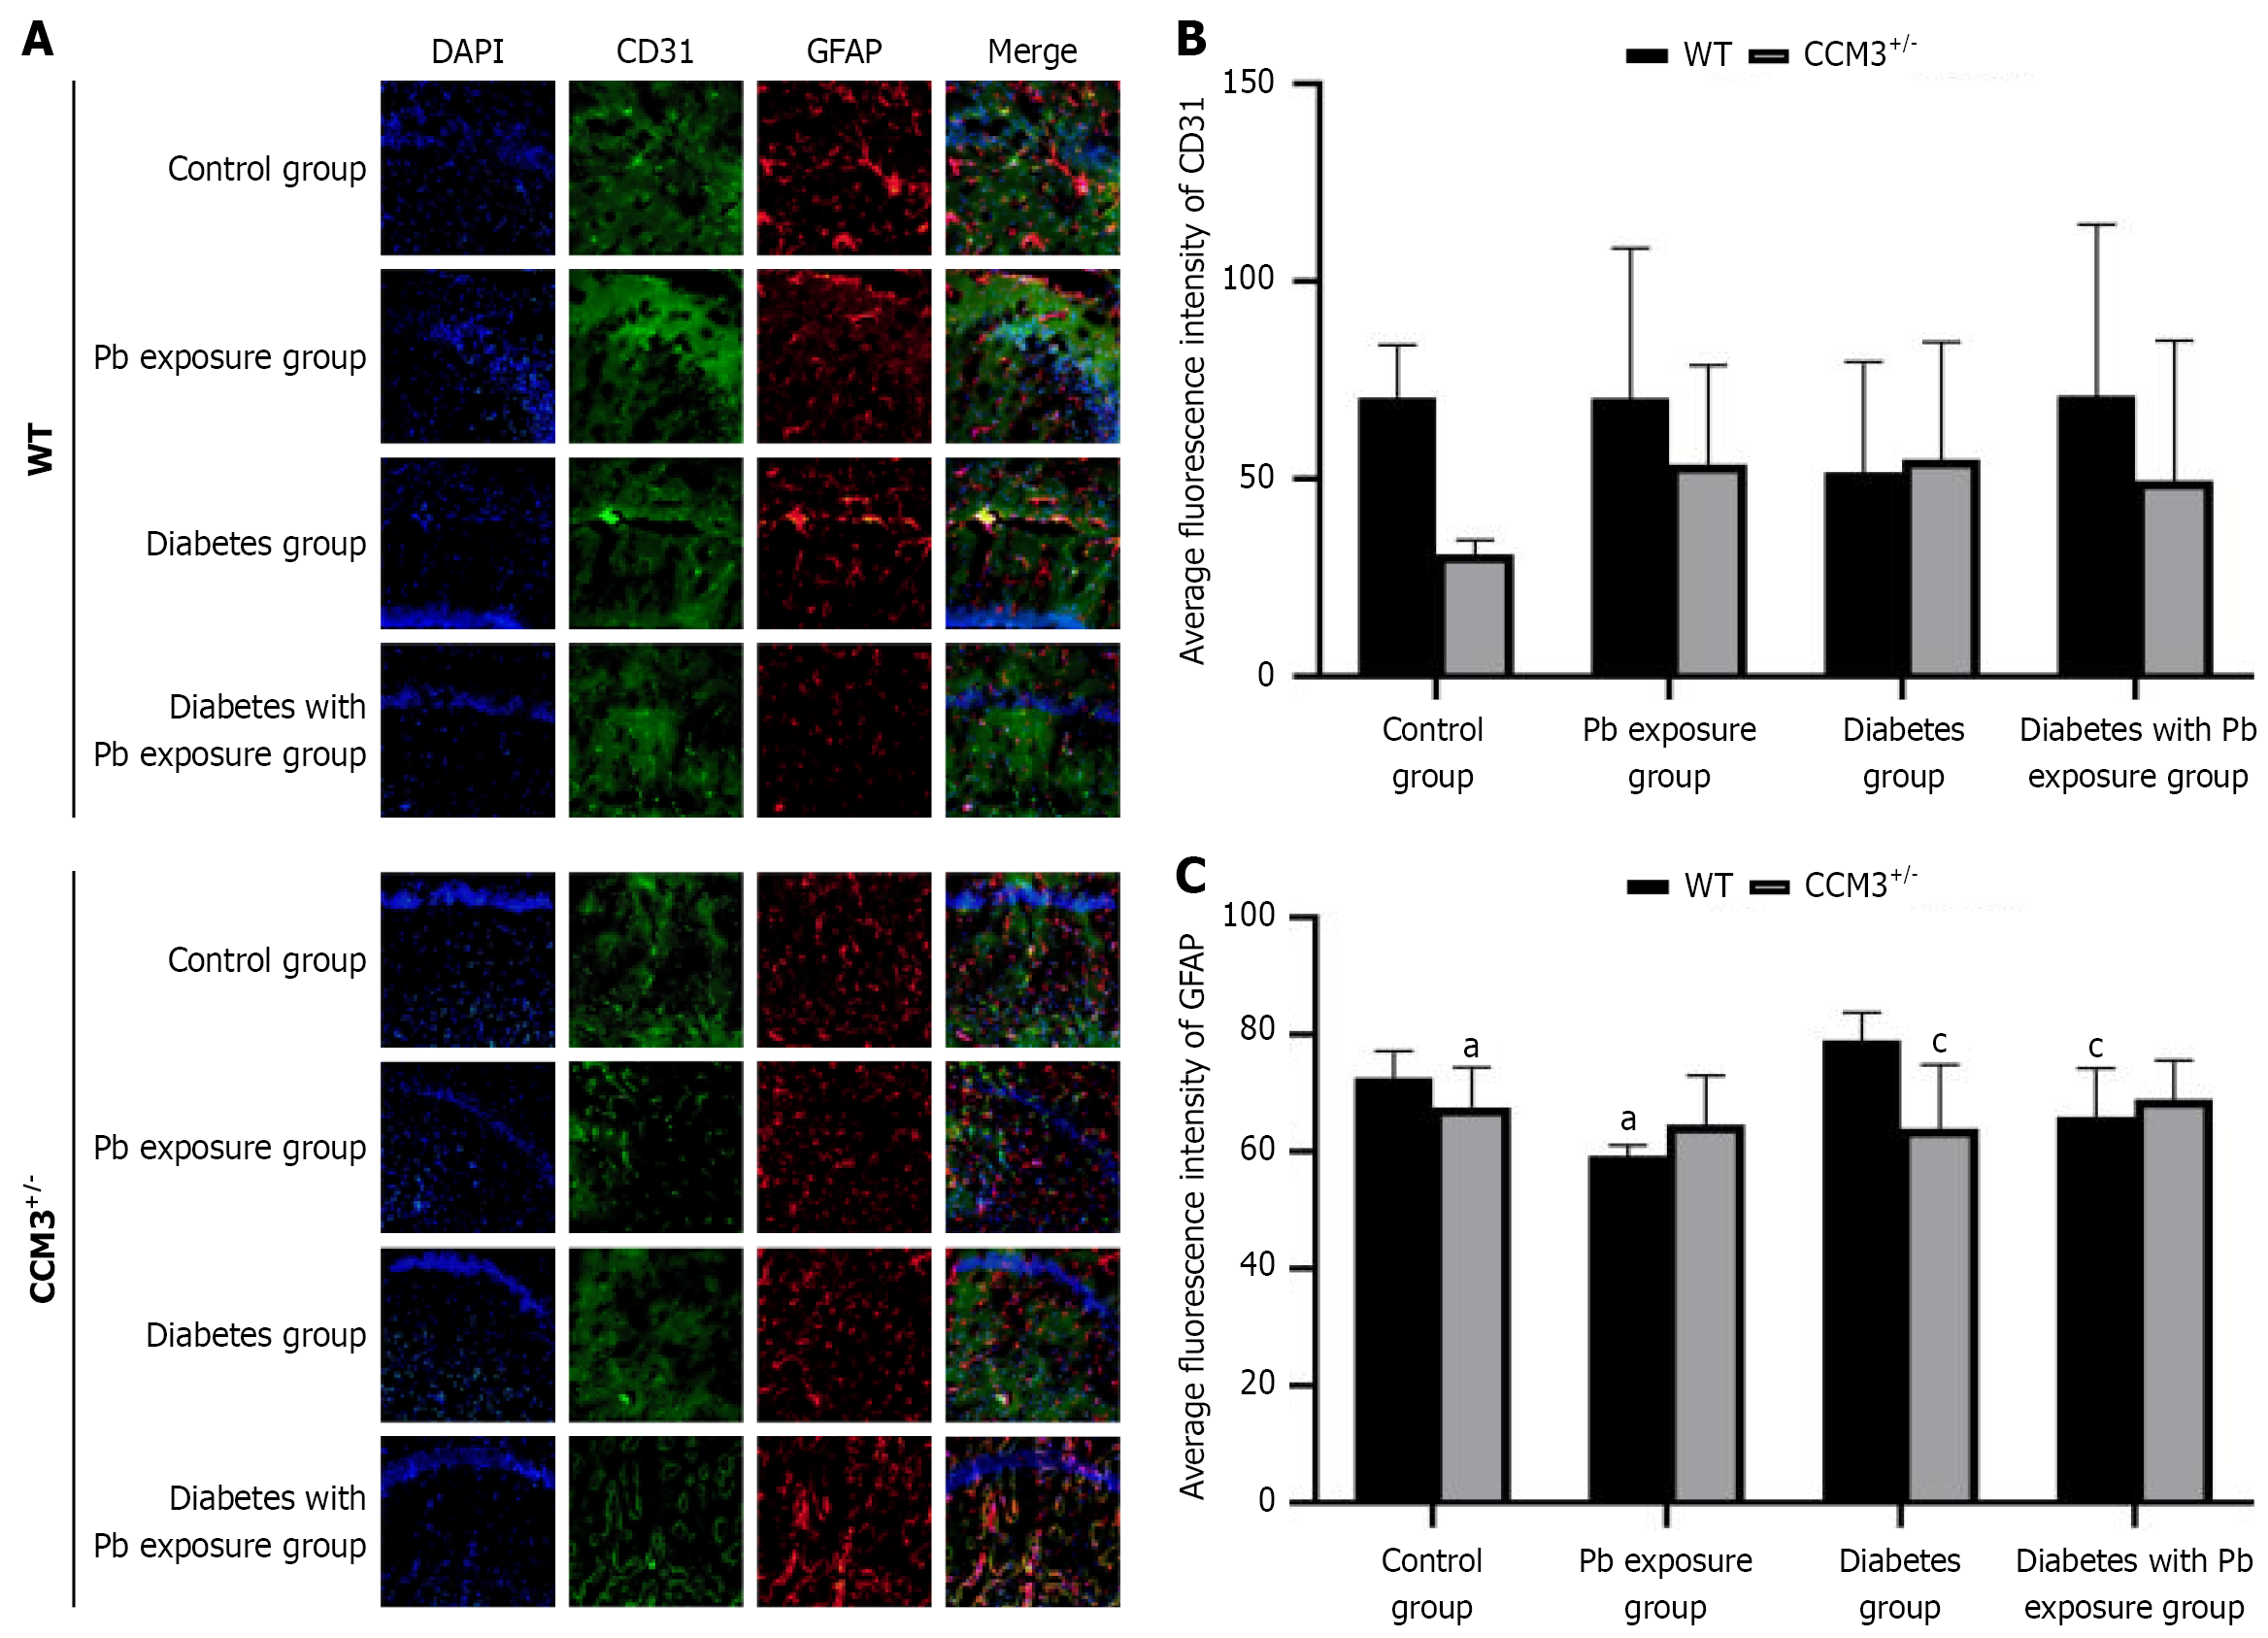
Figure 4 Fluorescence co-localization results of CD31 and glial fibrillary acidic protein in the hippocampus of mice in each group.
A: Expression of CD31 and glial fibrillary acidic protein (GFAP) in the hippocampus of mice in each group, B: Average fluorescence intensity of CD31, C: Average fluorescence intensity of GFAP. aP < 0.05 vs wild-type control group, cP < 0.05 vs wild-type diabetes group. WT: Wild-type.
- Citation: Liang X, Yang LX, Tao T, Ding WJ, Tang XY, Shang ZB, Zhou H, He Y, Sun Y. Role of CCM3 in lead-induced neurological damage in diabetes. World J Diabetes 2026; 17(8): 113938
- URL: https://www.wjgnet.com/1948-9358/full/v17/i8/113938.htm
- DOI: https://dx.doi.org/10.4239/wjd.113938