
















Copyright: ©Author(s) 2026.
World J Diabetes. Jul 15, 2026; 17(7): 121202
Published online Jul 15, 2026. doi: 10.4239/wjd.121202
Published online Jul 15, 2026. doi: 10.4239/wjd.121202
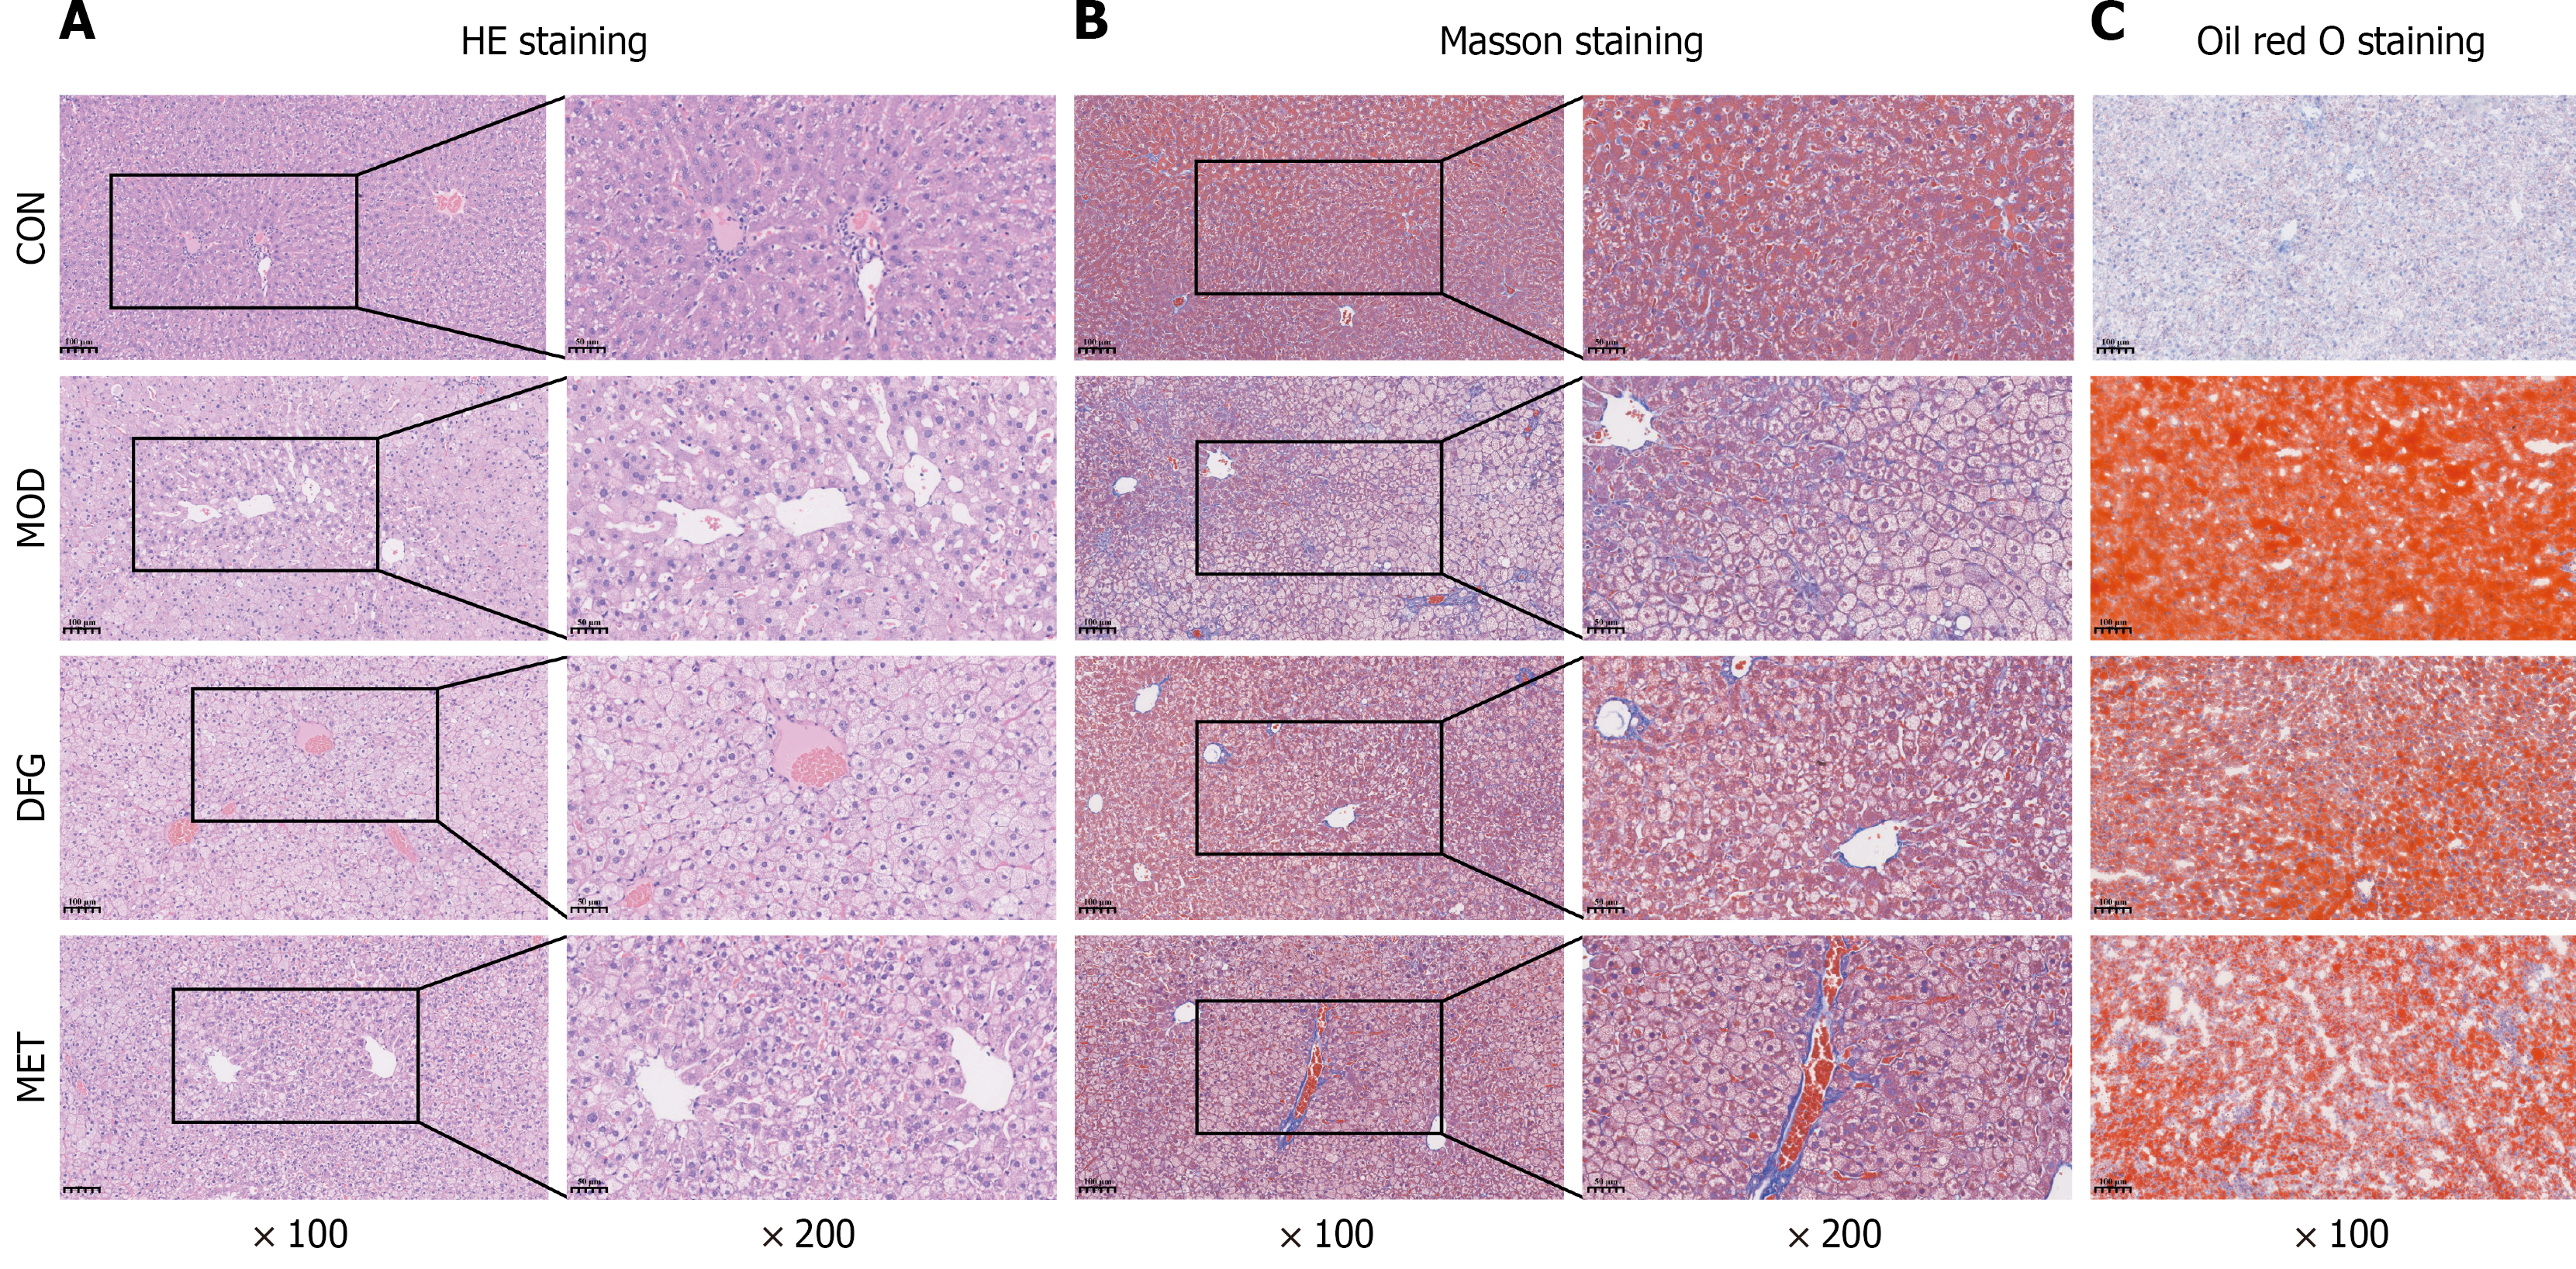
Figure 3 Comparison of hepatic histopathological changes.
A: Hematoxylin and eosin staining of liver tissue (× 100/200); B: Masson staining of liver tissue (× 100/200); C: Oil red O staining of liver tissue (× 100). HE: Hematoxylin and eosin; CON: Control group; MOD: Model group; DFG: Dangua Fang group; MET: Metformin group.
- Citation: Han Z, Wang ZT, Yang LQ, Heng XP. Regulatory effects of Dangua Fang on the NAMPT/NAD+/SIRT1 axis and amino acid metabolism in type 2 diabetic rats. World J Diabetes 2026; 17(7): 121202
- URL: https://www.wjgnet.com/1948-9358/full/v17/i7/121202.htm
- DOI: https://dx.doi.org/10.4239/wjd.121202