
















Copyright: ©Author(s) 2026.
World J Diabetes. Jul 15, 2026; 17(7): 120647
Published online Jul 15, 2026. doi: 10.4239/wjd.120647
Published online Jul 15, 2026. doi: 10.4239/wjd.120647
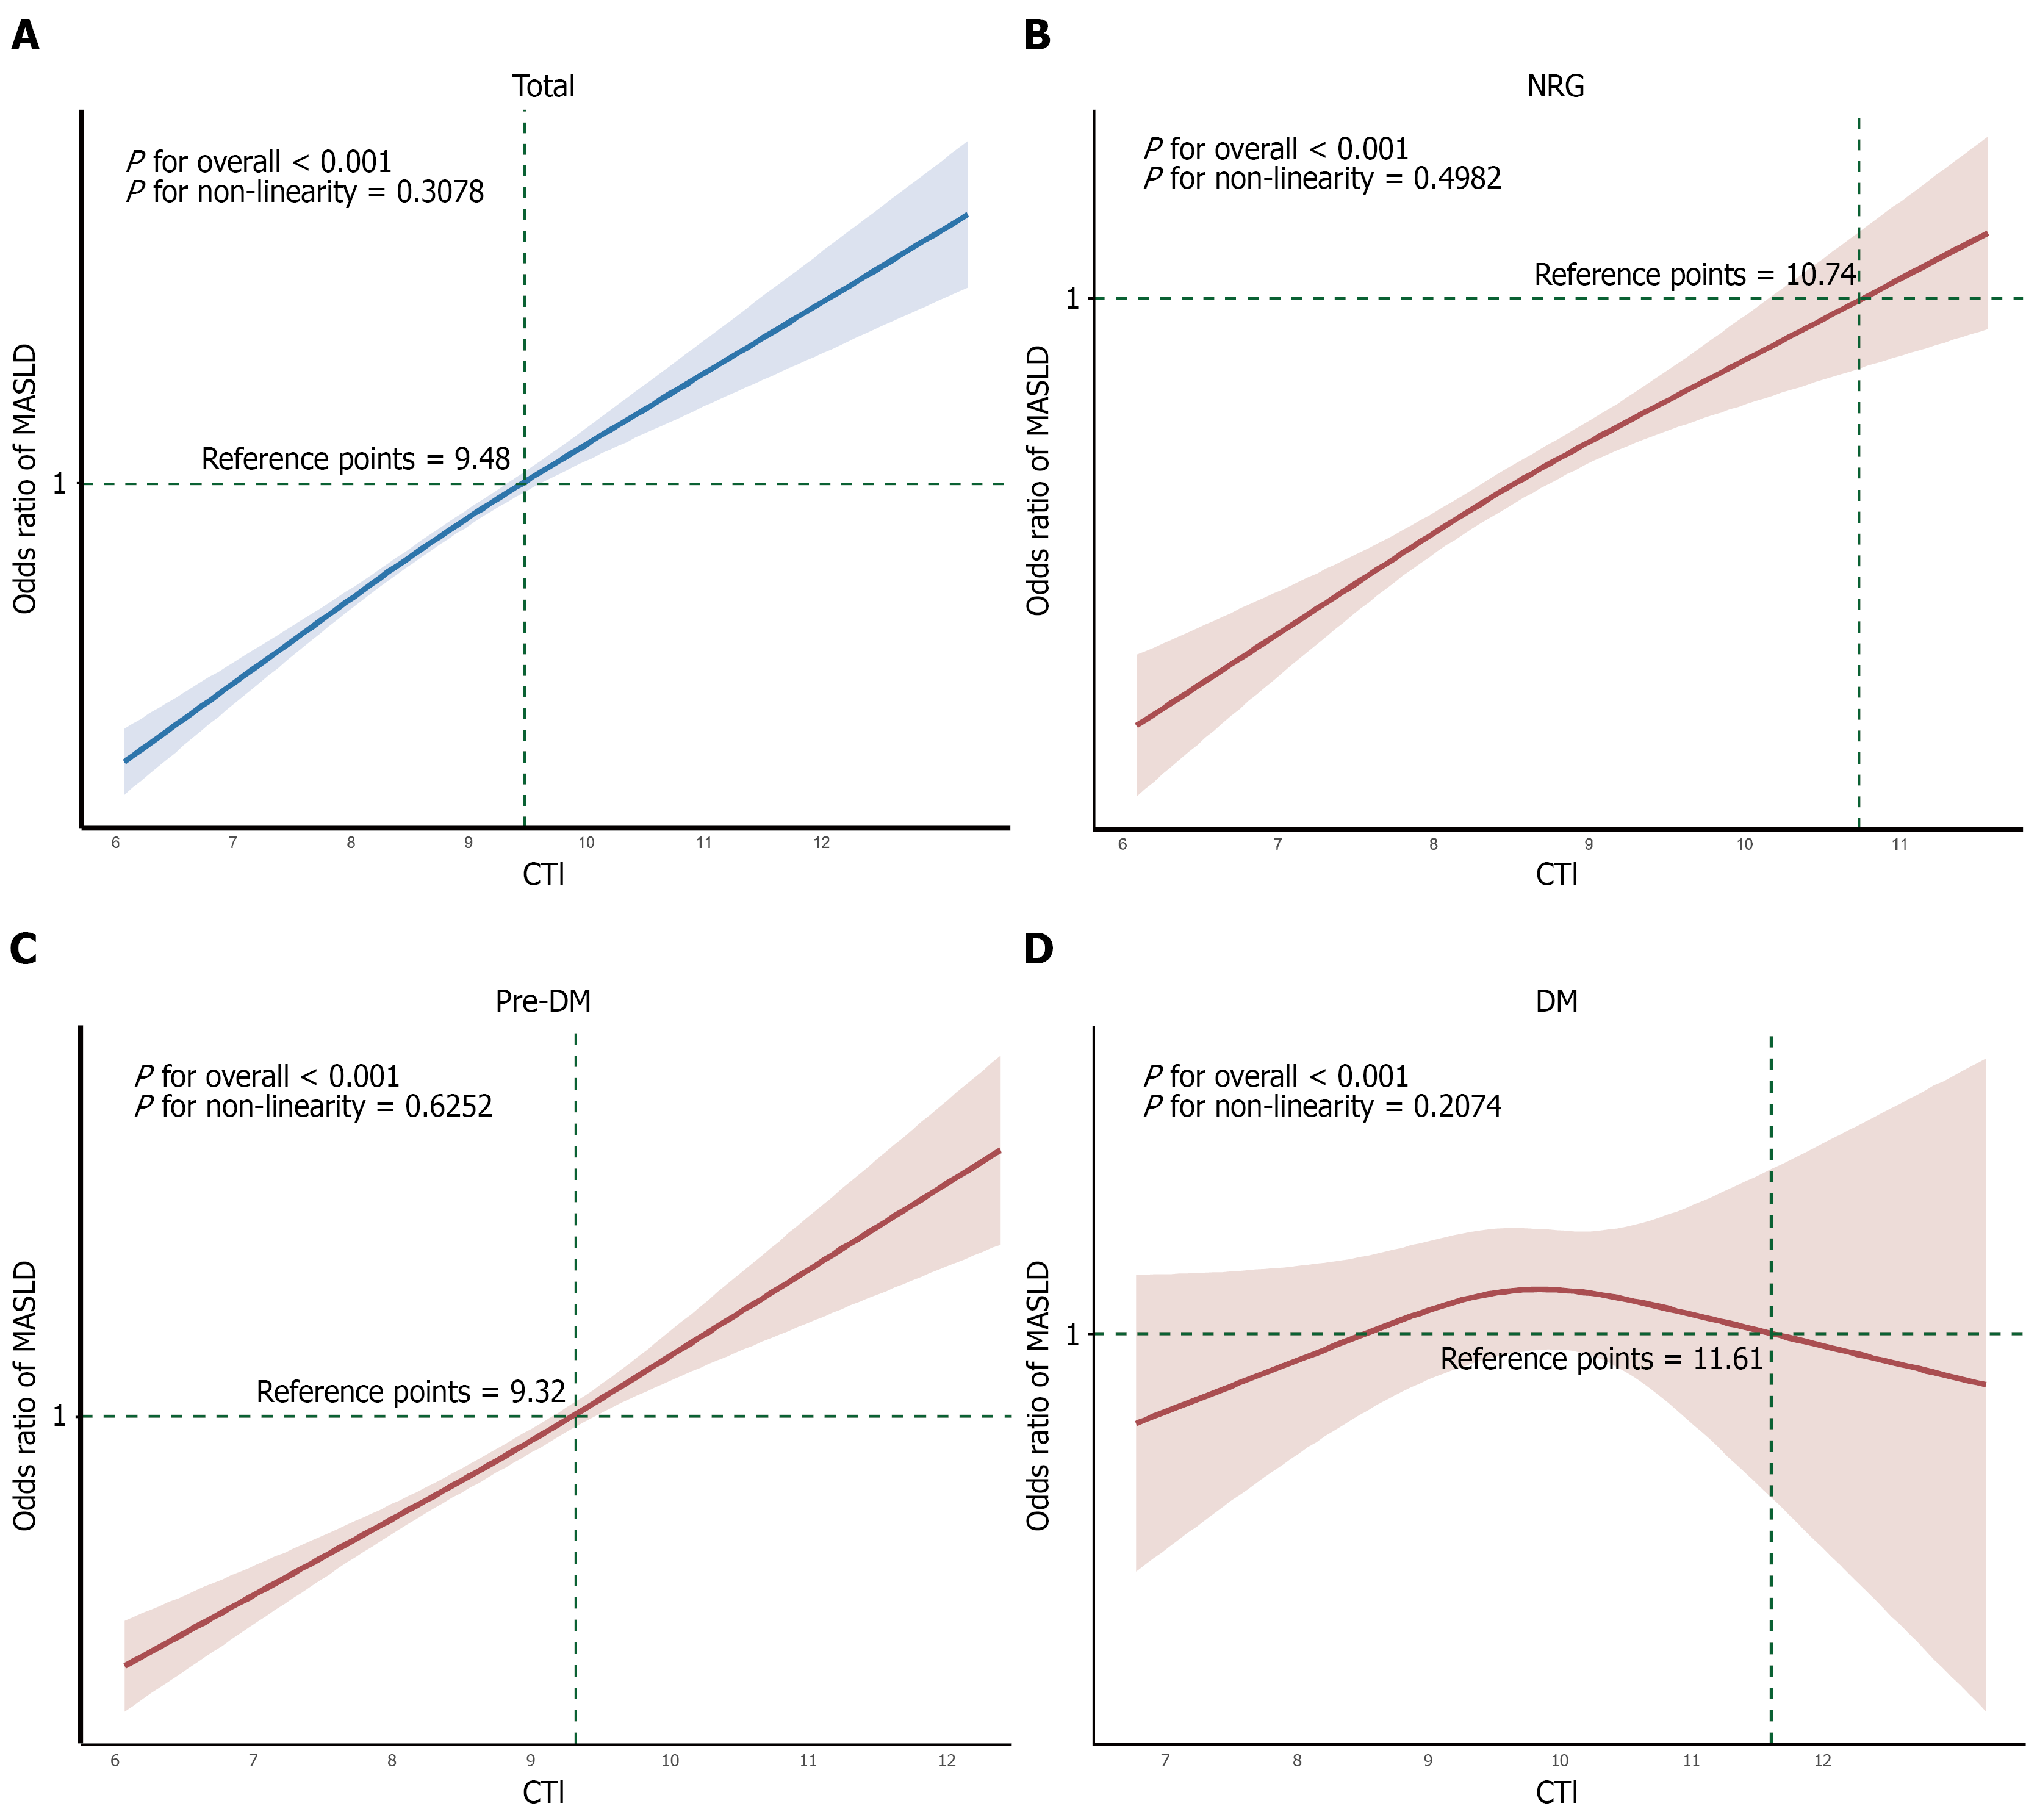
Figure 3 Dose-response relationships between C-reactive protein-triglyceride-glucose index and metabolic dysfunction–associated steatotic liver disease using restricted cubic splines.
A-D: Restricted cubic splines curves depicting the dose-response relationship between C-reactive protein-triglyceride-glucose index and metabolic dysfunction-associated steatotic liver disease odds ratios across glycemic states: Total population (A), normal glucose regulation (B), prediabetes mellitus (C), and diabetes mellitus (D). Adjusted for age, sex, current smoking, current drinking, regular exercise, systolic blood pressure, diastolic blood pressure, hip circumference, aspartate aminotransferase, total protein, total bilirubin, direct bilirubin, total cholesterol, high-density lipoprotein cholesterol (HDL-C), low-density lipoprotein cholesterol, platelet count, albumin, glycated haemoglobin, estimated glomerular filtration rate, blood urea nitrogen, history of hypertension, history of hypertriglyceridemia, history of low HDL-C. MASLD: Metabolic dysfunction-associated steatotic liver disease; NGR: Normal glucose regulation; Pre-DM: Prediabetes mellitus; DM: Diabetes mellitus.
- Citation: Zhang WH, Shi RDQ, Chen K, Li XM, Yu GH, Ye XY, Xu Q, Ding Y, Luo SH. Association between the high-sensitivity C-reactive protein-triglyceride-glucose index and metabolic dysfunction-associated steatotic liver disease across different glycemic states. World J Diabetes 2026; 17(7): 120647
- URL: https://www.wjgnet.com/1948-9358/full/v17/i7/120647.htm
- DOI: https://dx.doi.org/10.4239/wjd.120647