
















Copyright: ©Author(s) 2026.
World J Diabetes. Jul 15, 2026; 17(7): 119604
Published online Jul 15, 2026. doi: 10.4239/wjd.119604
Published online Jul 15, 2026. doi: 10.4239/wjd.119604
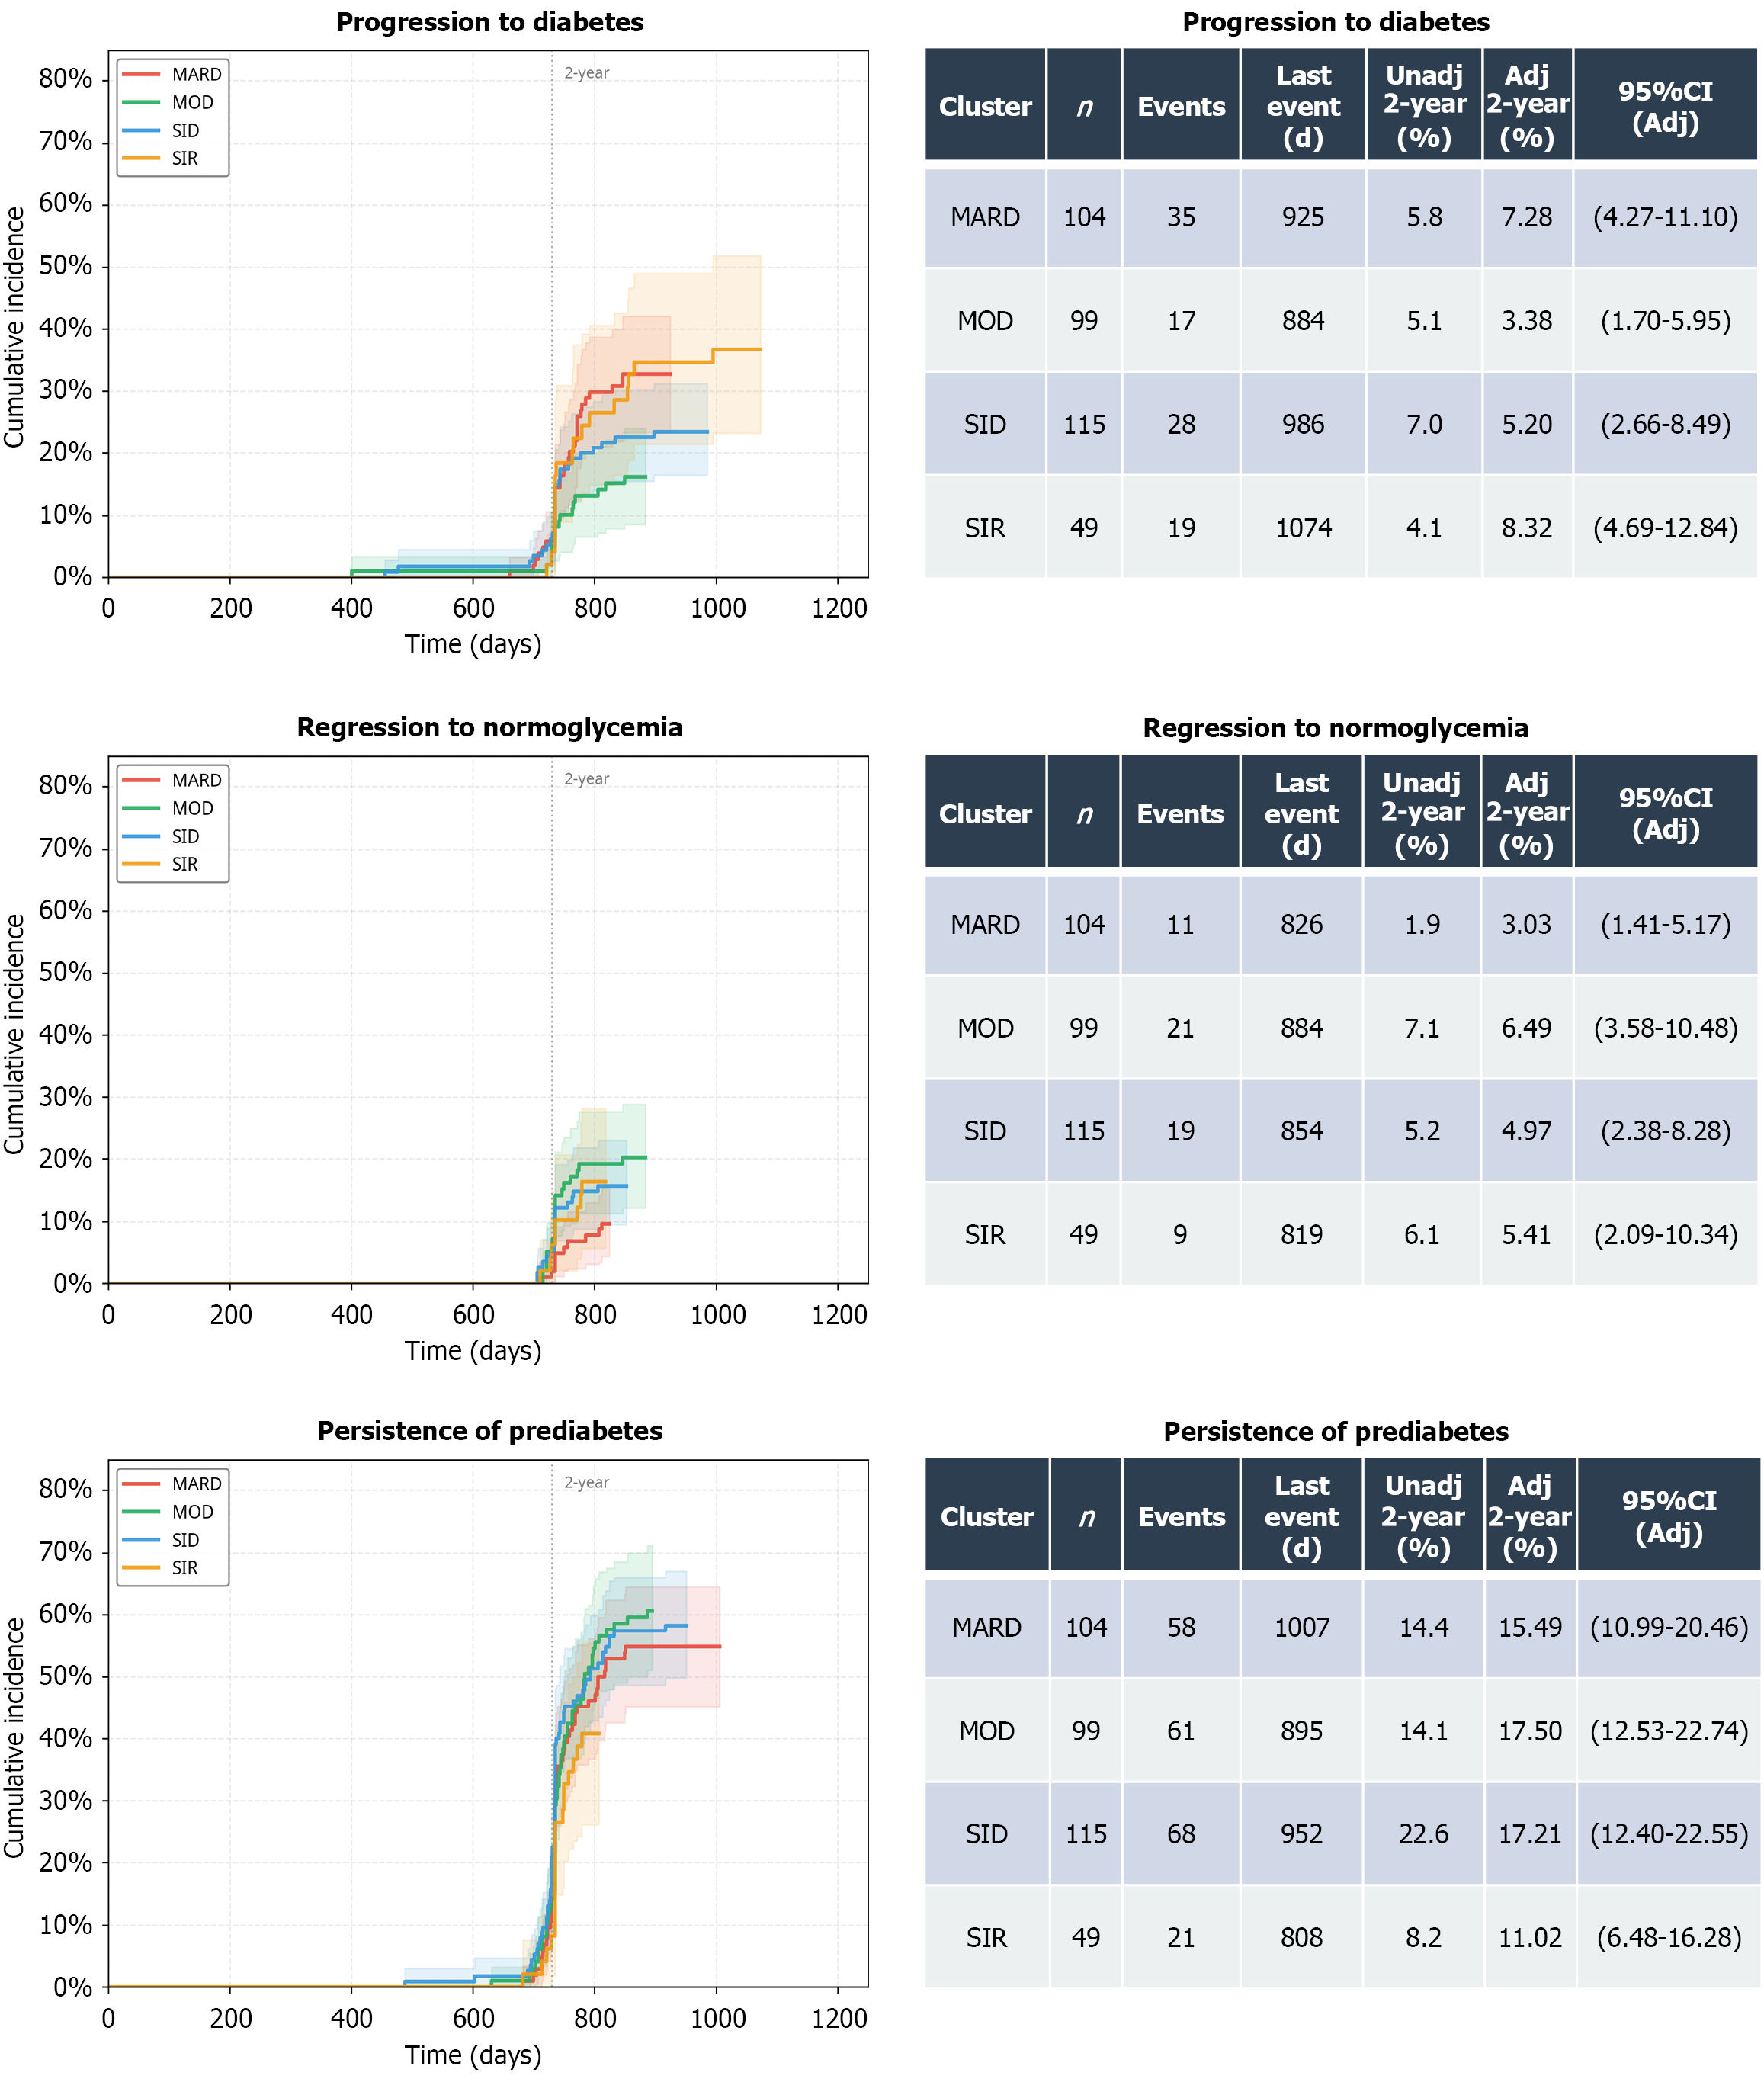
Figure 3 Cumulative incidence functions (Aalen-Johansen) with adjusted 2-year cumulative incidence function.
Panels show Aalen-Johansen cumulative incidence curves for progression to diabetes, regression to normoglycemia, and persistence of prediabetes across the four metabolic subtypes. Shaded bands indicate 95% confidence intervals from 500 bootstrap resamples, and the vertical dotted line marks 2 years. Tables below each panel summarize sample size, events, last event time, unadjusted 2-year cumulative incidence, adjusted 2-year cumulative incidence, and 95% confidence intervals. Adjusted 2-year cumulative incidence was estimated with Fine-Gray competing risk models and marginal standardization, adjusting for subtype, intervention, and sex. MARD: Mild age-related dysmetabolism; MOD: Mild obesity-related dysmetabolism; SID: Severe insulin deficiency; SIR: Severe insulin resistance; CI: Confidence interval.
- Citation: Zhang SH, Zhang JP, Song LL, Wu LL, Li ZQ, He YF, Deng RF, Ma WL, Zhang C, Zhang B, Yu LP. Metabolic feature-based clustering for subtype identification and longitudinal outcome predictions in the Chinese prediabetic population. World J Diabetes 2026; 17(7): 119604
- URL: https://www.wjgnet.com/1948-9358/full/v17/i7/119604.htm
- DOI: https://dx.doi.org/10.4239/wjd.119604