
















Copyright: ©Author(s) 2026.
World J Diabetes. Jul 15, 2026; 17(7): 119604
Published online Jul 15, 2026. doi: 10.4239/wjd.119604
Published online Jul 15, 2026. doi: 10.4239/wjd.119604
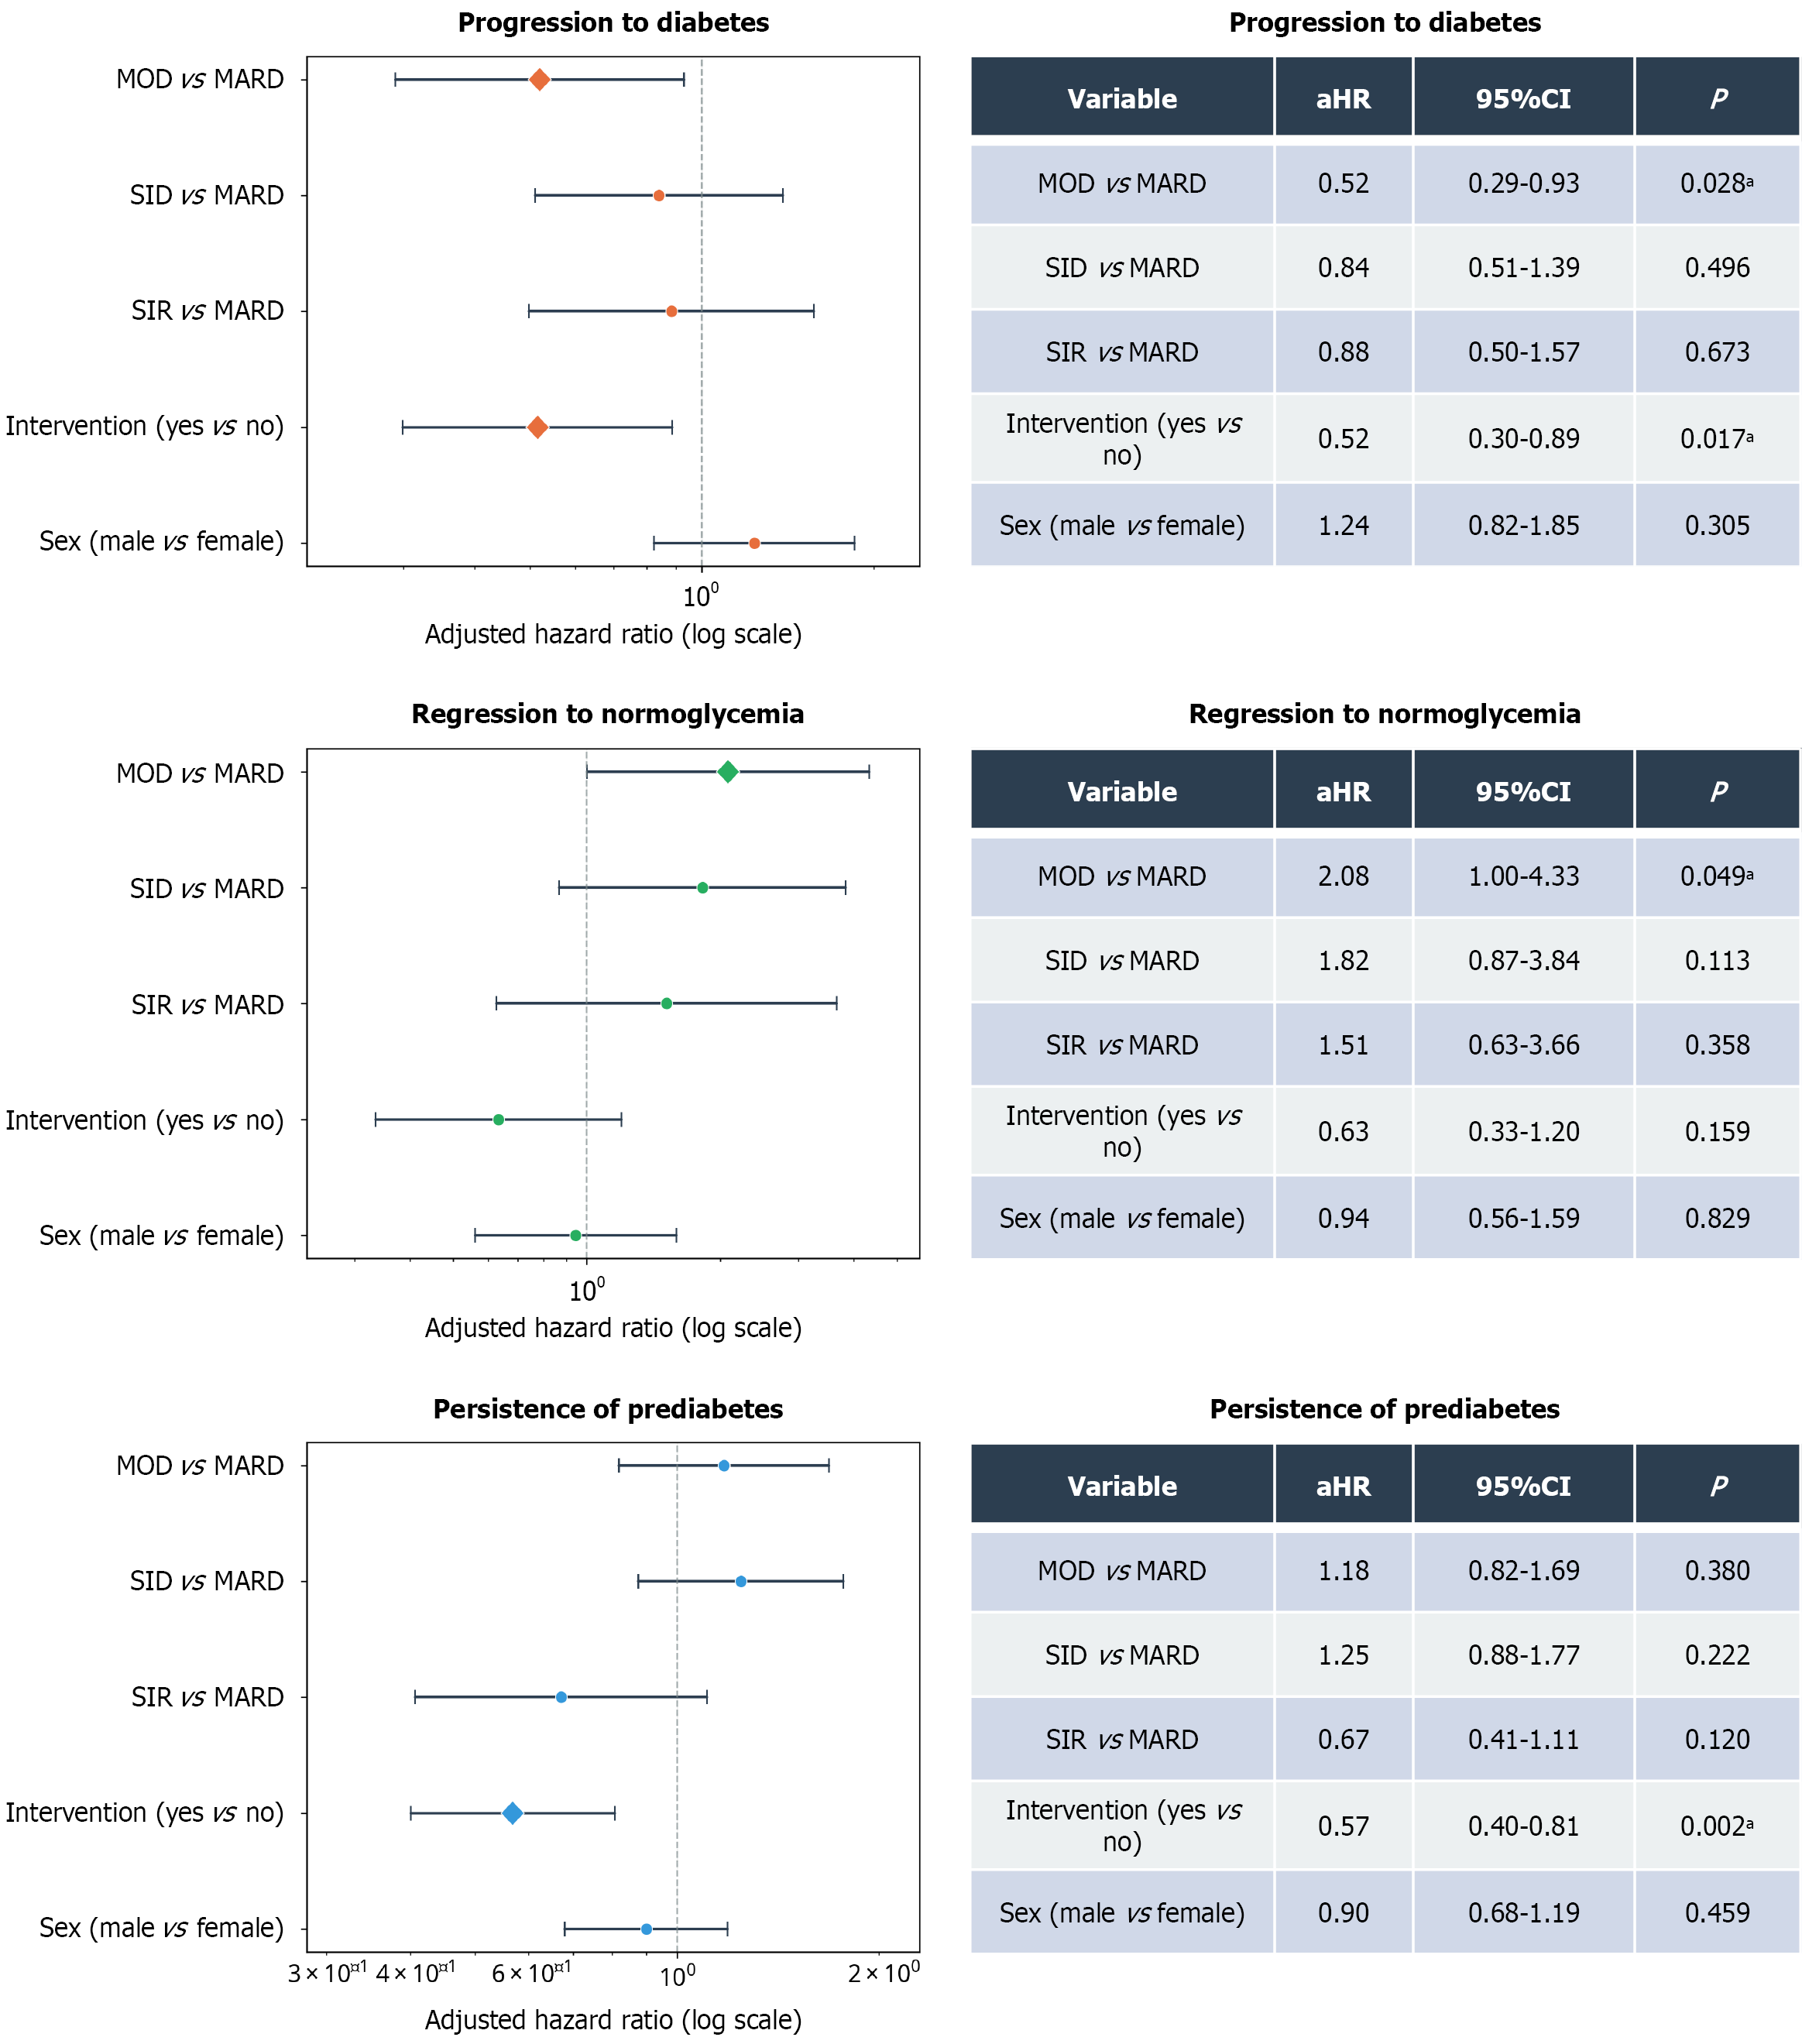
Figure 2 Forest plot of adjusted hazard ratios (cause-specific Cox models).
Panels show the associations of subtype, intervention, and sex with progression to diabetes, regression to normoglycemia, and persistence of prediabetes. Points indicate adjusted hazard ratios and horizontal lines indicate 95% confidence intervals; the dashed vertical line marks the null value (adjusted hazard ratio = 1.0). Models were adjusted for diabetes subtype, intervention status, and sex, with mild age-related dysmetabolism as the reference subtype. aP < 0.05. aHR: Adjusted hazard ratio; CI: Confidence interval; MARD: Mild age-related dysmetabolism; MOD: Mild obesity-related dysmetabolism; SID: Severe insulin deficiency; SIR: Severe insulin resistance.
- Citation: Zhang SH, Zhang JP, Song LL, Wu LL, Li ZQ, He YF, Deng RF, Ma WL, Zhang C, Zhang B, Yu LP. Metabolic feature-based clustering for subtype identification and longitudinal outcome predictions in the Chinese prediabetic population. World J Diabetes 2026; 17(7): 119604
- URL: https://www.wjgnet.com/1948-9358/full/v17/i7/119604.htm
- DOI: https://dx.doi.org/10.4239/wjd.119604