
















Copyright: ©Author(s) 2026.
World J Diabetes. Jun 15, 2026; 17(6): 120343
Published online Jun 15, 2026. doi: 10.4239/wjd.120343
Published online Jun 15, 2026. doi: 10.4239/wjd.120343
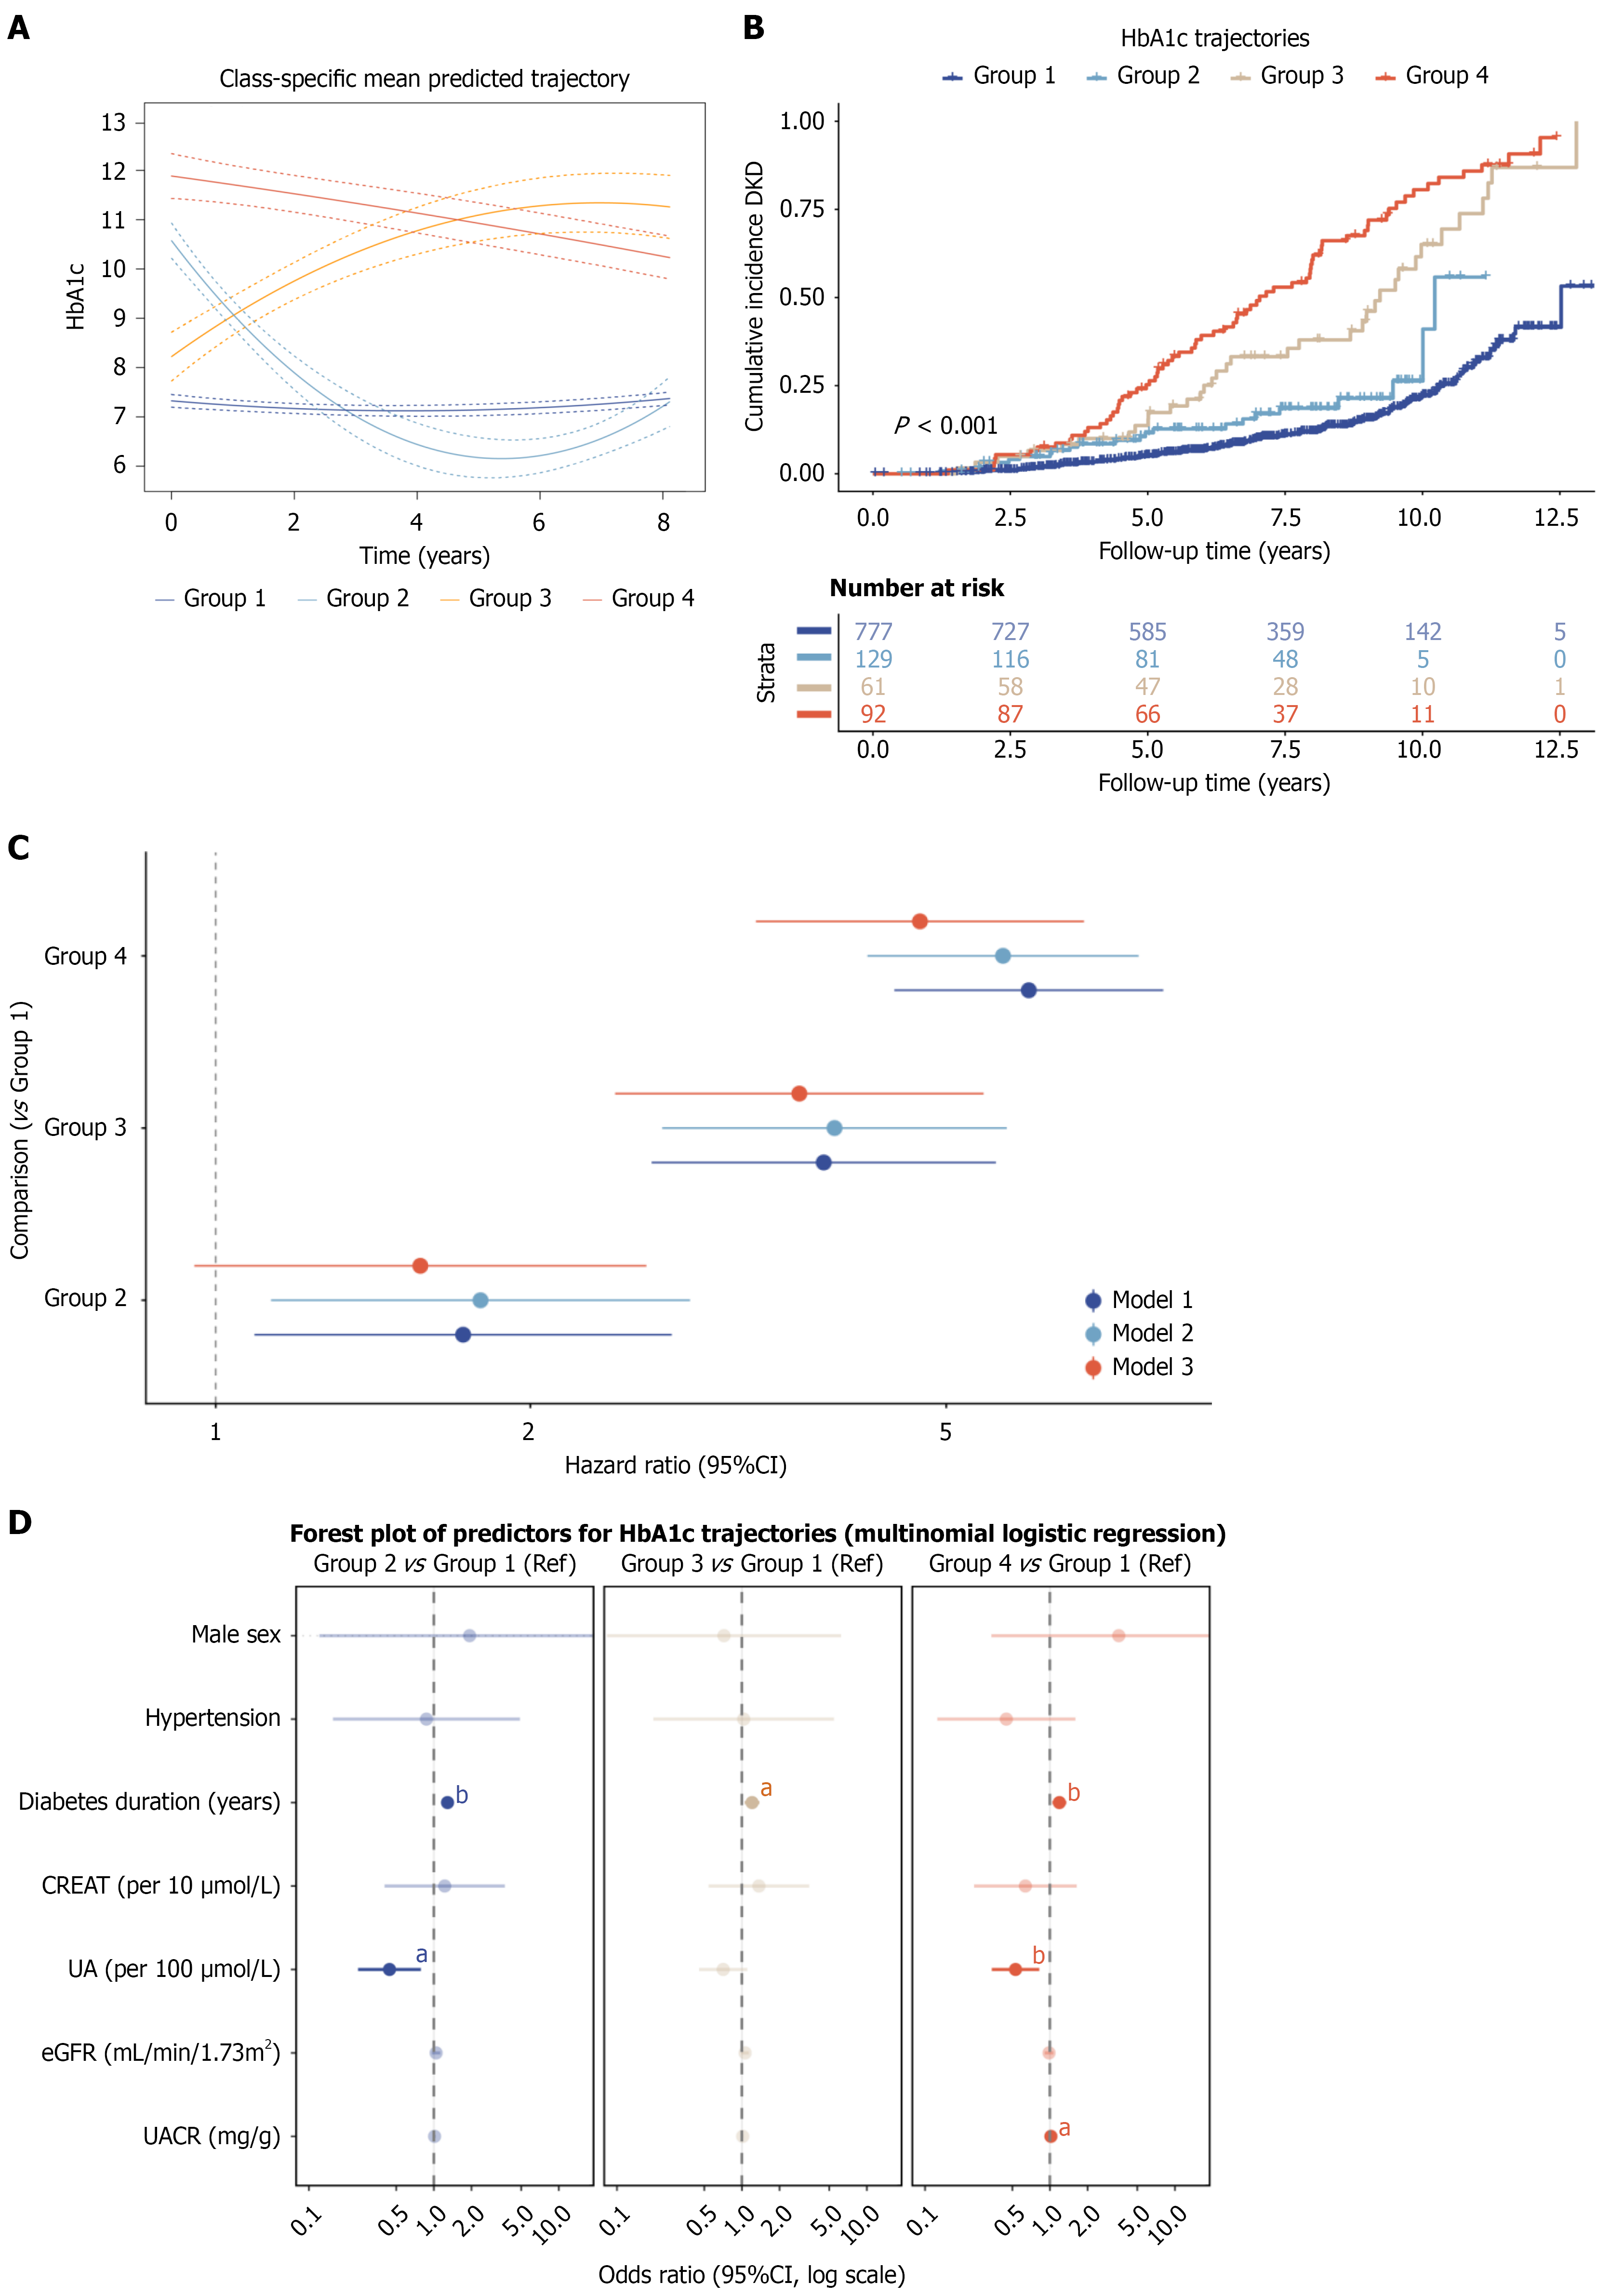
Figure 4 Identification of glycated hemoglobin trajectories and their associations with incident diabetic kidney disease.
A: Class-specific mean predicted trajectories of glycated hemoglobin (HbA1c) over time, derived from group-based trajectory modeling; B: Kaplan-Meier cumulative incidence curves for diabetic kidney disease (DKD) stratified by the four identified HbA1c trajectory groups; C: Forest plot illustrating the hazard ratios and 95% confidence intervals for incident DKD across trajectory groups, with group 1 (low-stable) as the reference. Model 1 was unadjusted. Model 2 was adjusted for age and sex. Model 3 was adjusted for age, sex, body mass index, hypertension, major adverse cardiovascular and cerebrovascular events, hyperlipidemia, angiotensin-converting enzyme inhibitor/angiotensin II receptor blocker treatment, diabetes duration, blood urea nitrogen, creatinine, uric acid, low-density lipoprotein cholesterol, lipoprotein(a), urinary albumin-to-creatinine ratio, and measurement intensity; D: Forest plot showing the odds ratios and 95% confidence intervals from multivariable multinomial logistic regression analysis for baseline predictors of trajectory membership, with group 1 serving as the reference category. aP < 0.05 vs group 1. bP < 0.01 vs group 1. DKD: Diabetic kidney disease; HbA1c: Glycated hemoglobin; CI: Confidence interval; CREAT: Creatinine; UA: Uric acid; eGFR: Estimated glomerular filtration rate; UACR: Urinary albumin-to-creatinine ratio.
- Citation: Zou HY, Jiang H, Guo XD, Wen ZY, Shi Y, Zhou AD, Wang MM, Xu F, Cai MY. Dynamic glycemic exposure and trajectory profiling for incident diabetic kidney disease: A longitudinal cohort study. World J Diabetes 2026; 17(6): 120343
- URL: https://www.wjgnet.com/1948-9358/full/v17/i6/120343.htm
- DOI: https://dx.doi.org/10.4239/wjd.120343