
















Copyright: ©Author(s) 2026.
World J Diabetes. Jun 15, 2026; 17(6): 120343
Published online Jun 15, 2026. doi: 10.4239/wjd.120343
Published online Jun 15, 2026. doi: 10.4239/wjd.120343
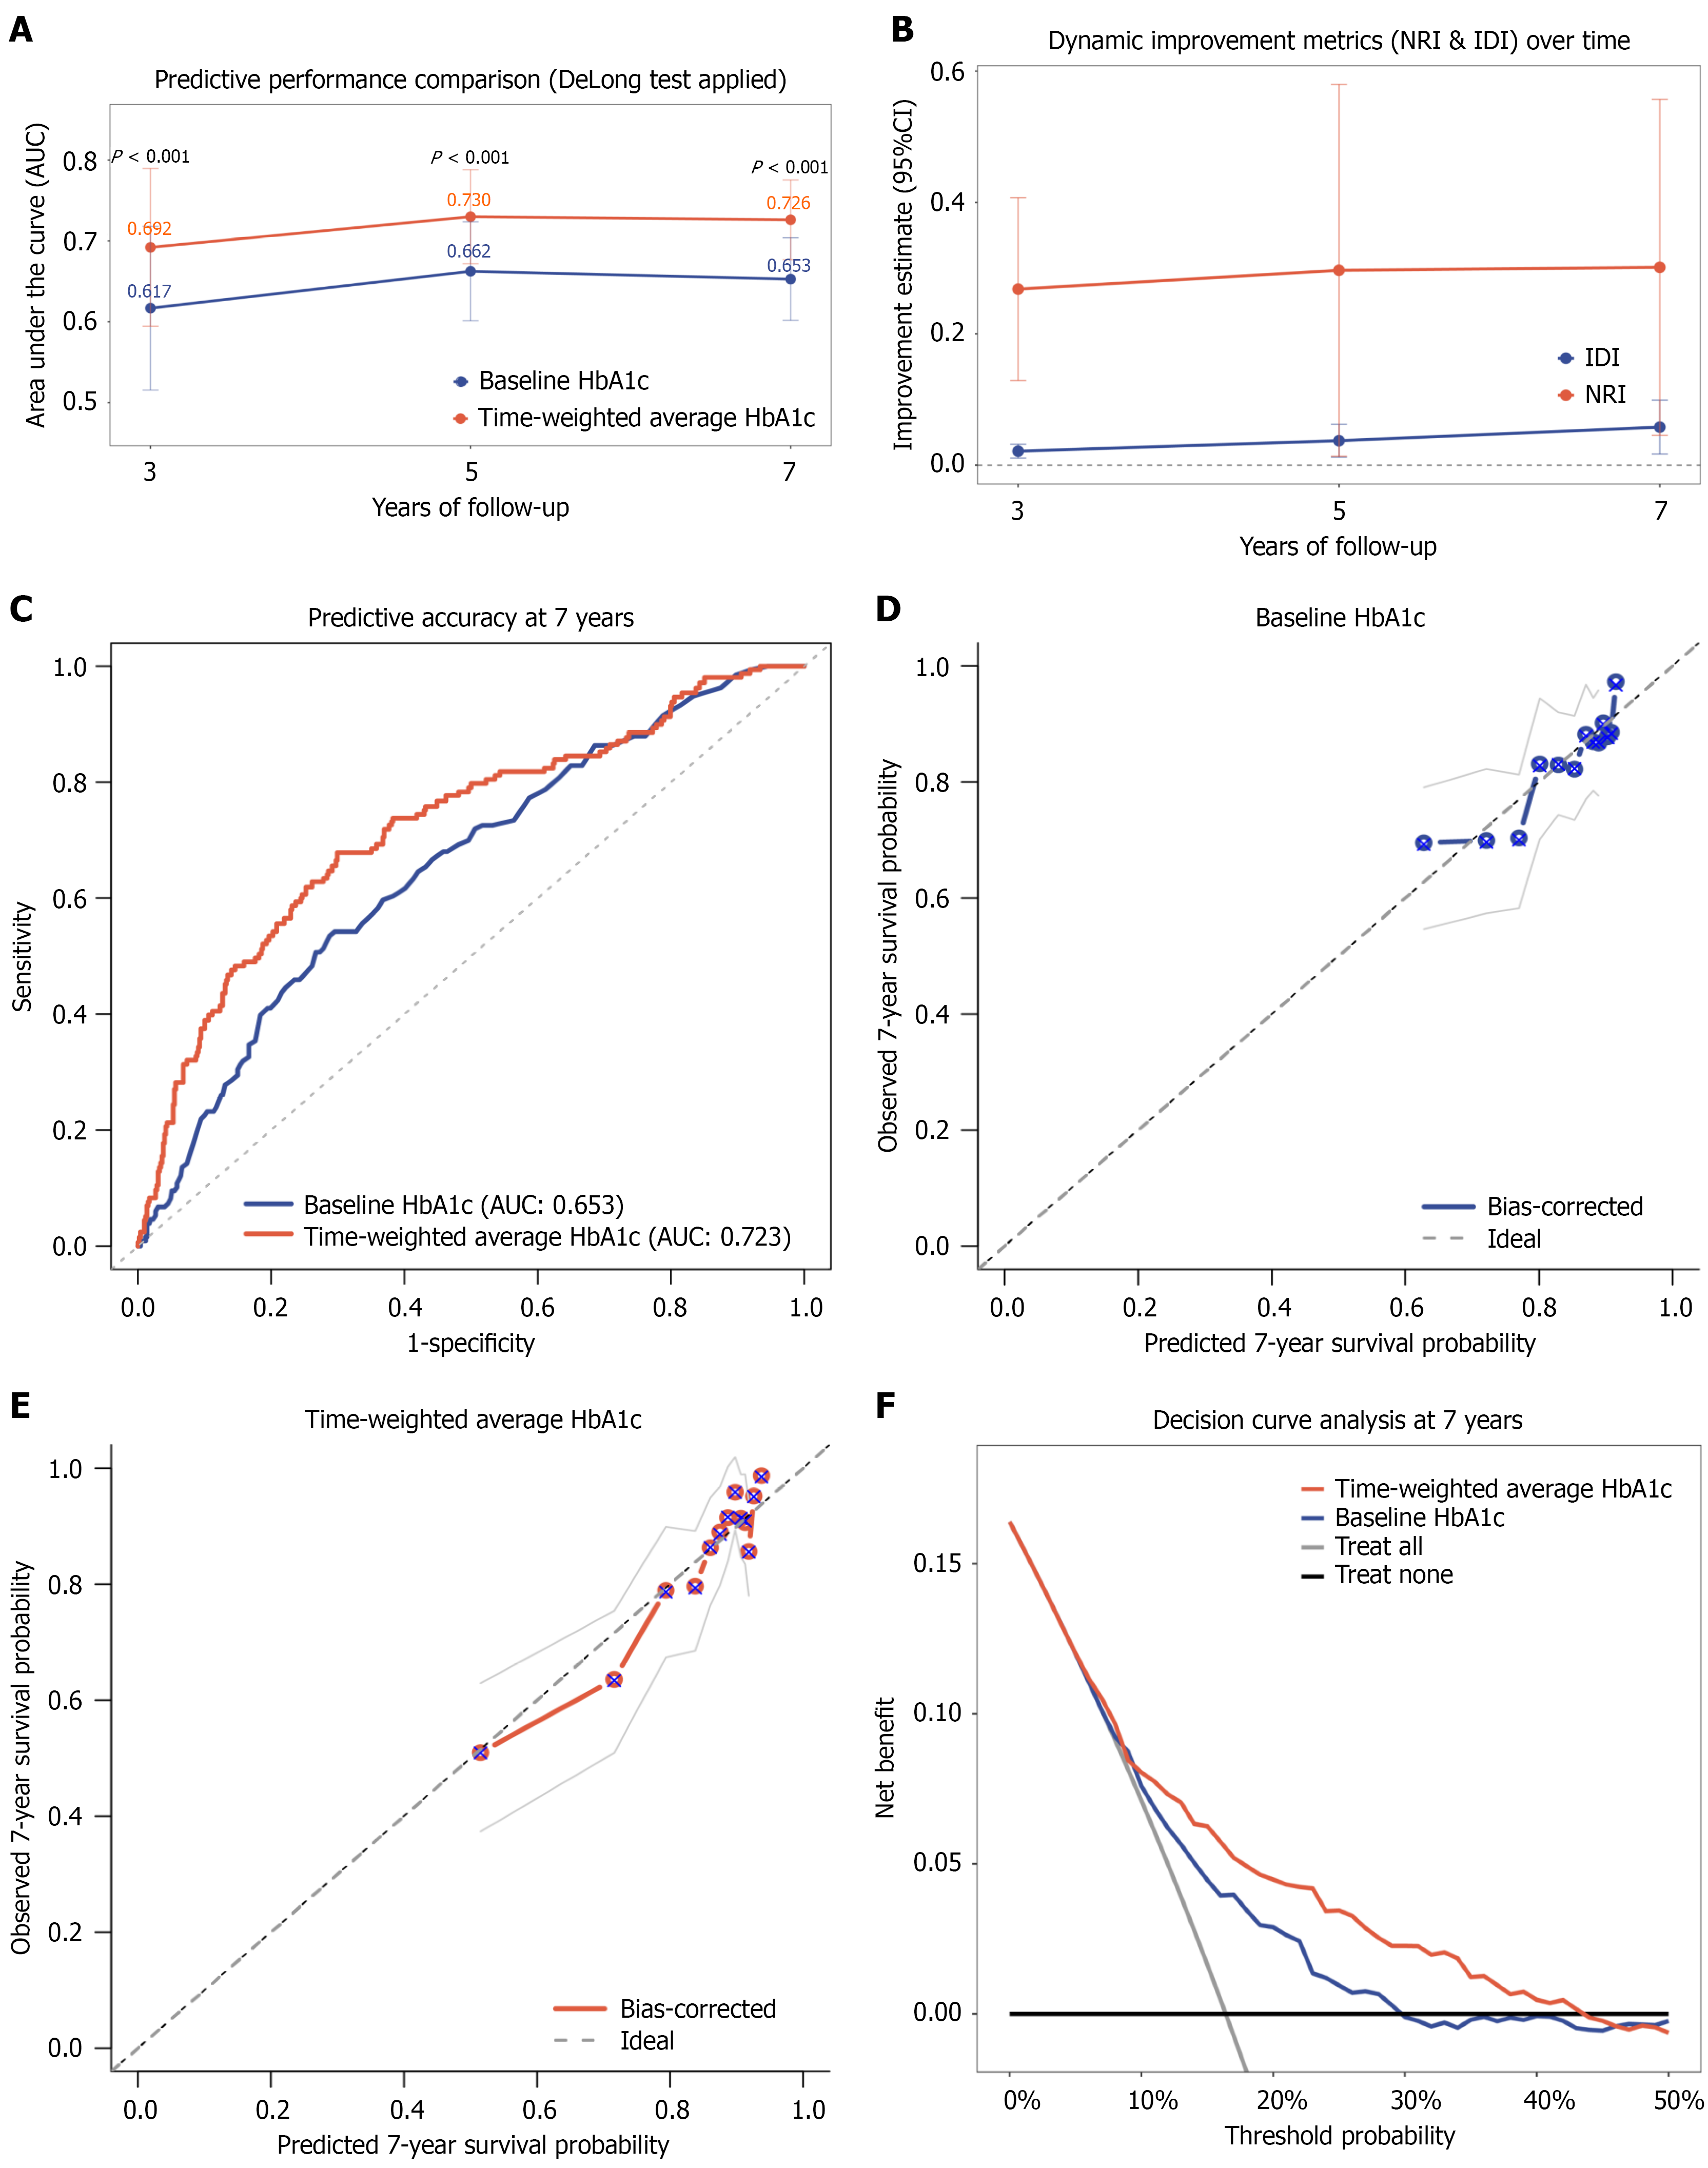
Figure 3 Predictive performance and clinical utility of baseline glycated hemoglobin vs time-weighted average glycated hemoglobin for incident diabetic kidney disease.
A: Comparison of time-dependent areas under the receiver operating characteristic curves (AUCs) at 3 years, 5 years, and 7 years of follow-up (P values derived from DeLong’s test); B: Dynamic variations of integrated discrimination improvement and net reclassification improvement metrics over time; C: Time-dependent receiver operating characteristic curves comparing the discriminative ability of the two metrics for predicting diabetic kidney disease at 7 years; D: Calibration curves assessing the agreement between predicted and observed 7-year survival probabilities for baseline glycated hemoglobin (HbA1c); E: Calibration curves assessing the agreement between predicted and observed 7-year survival probabilities for time-weighted average HbA1c; F: Decision curve analysis evaluating the net clinical benefit of the predictive models at 7 years across a range of threshold probabilities. AUC: Area under the receiver operating characteristic curve; HbA1c: Glycated hemoglobin; IDI: Integrated discrimination improvement; NRI: Net reclassification improvement.
- Citation: Zou HY, Jiang H, Guo XD, Wen ZY, Shi Y, Zhou AD, Wang MM, Xu F, Cai MY. Dynamic glycemic exposure and trajectory profiling for incident diabetic kidney disease: A longitudinal cohort study. World J Diabetes 2026; 17(6): 120343
- URL: https://www.wjgnet.com/1948-9358/full/v17/i6/120343.htm
- DOI: https://dx.doi.org/10.4239/wjd.120343