
















Copyright: ©Author(s) 2026.
World J Diabetes. Jun 15, 2026; 17(6): 120343
Published online Jun 15, 2026. doi: 10.4239/wjd.120343
Published online Jun 15, 2026. doi: 10.4239/wjd.120343
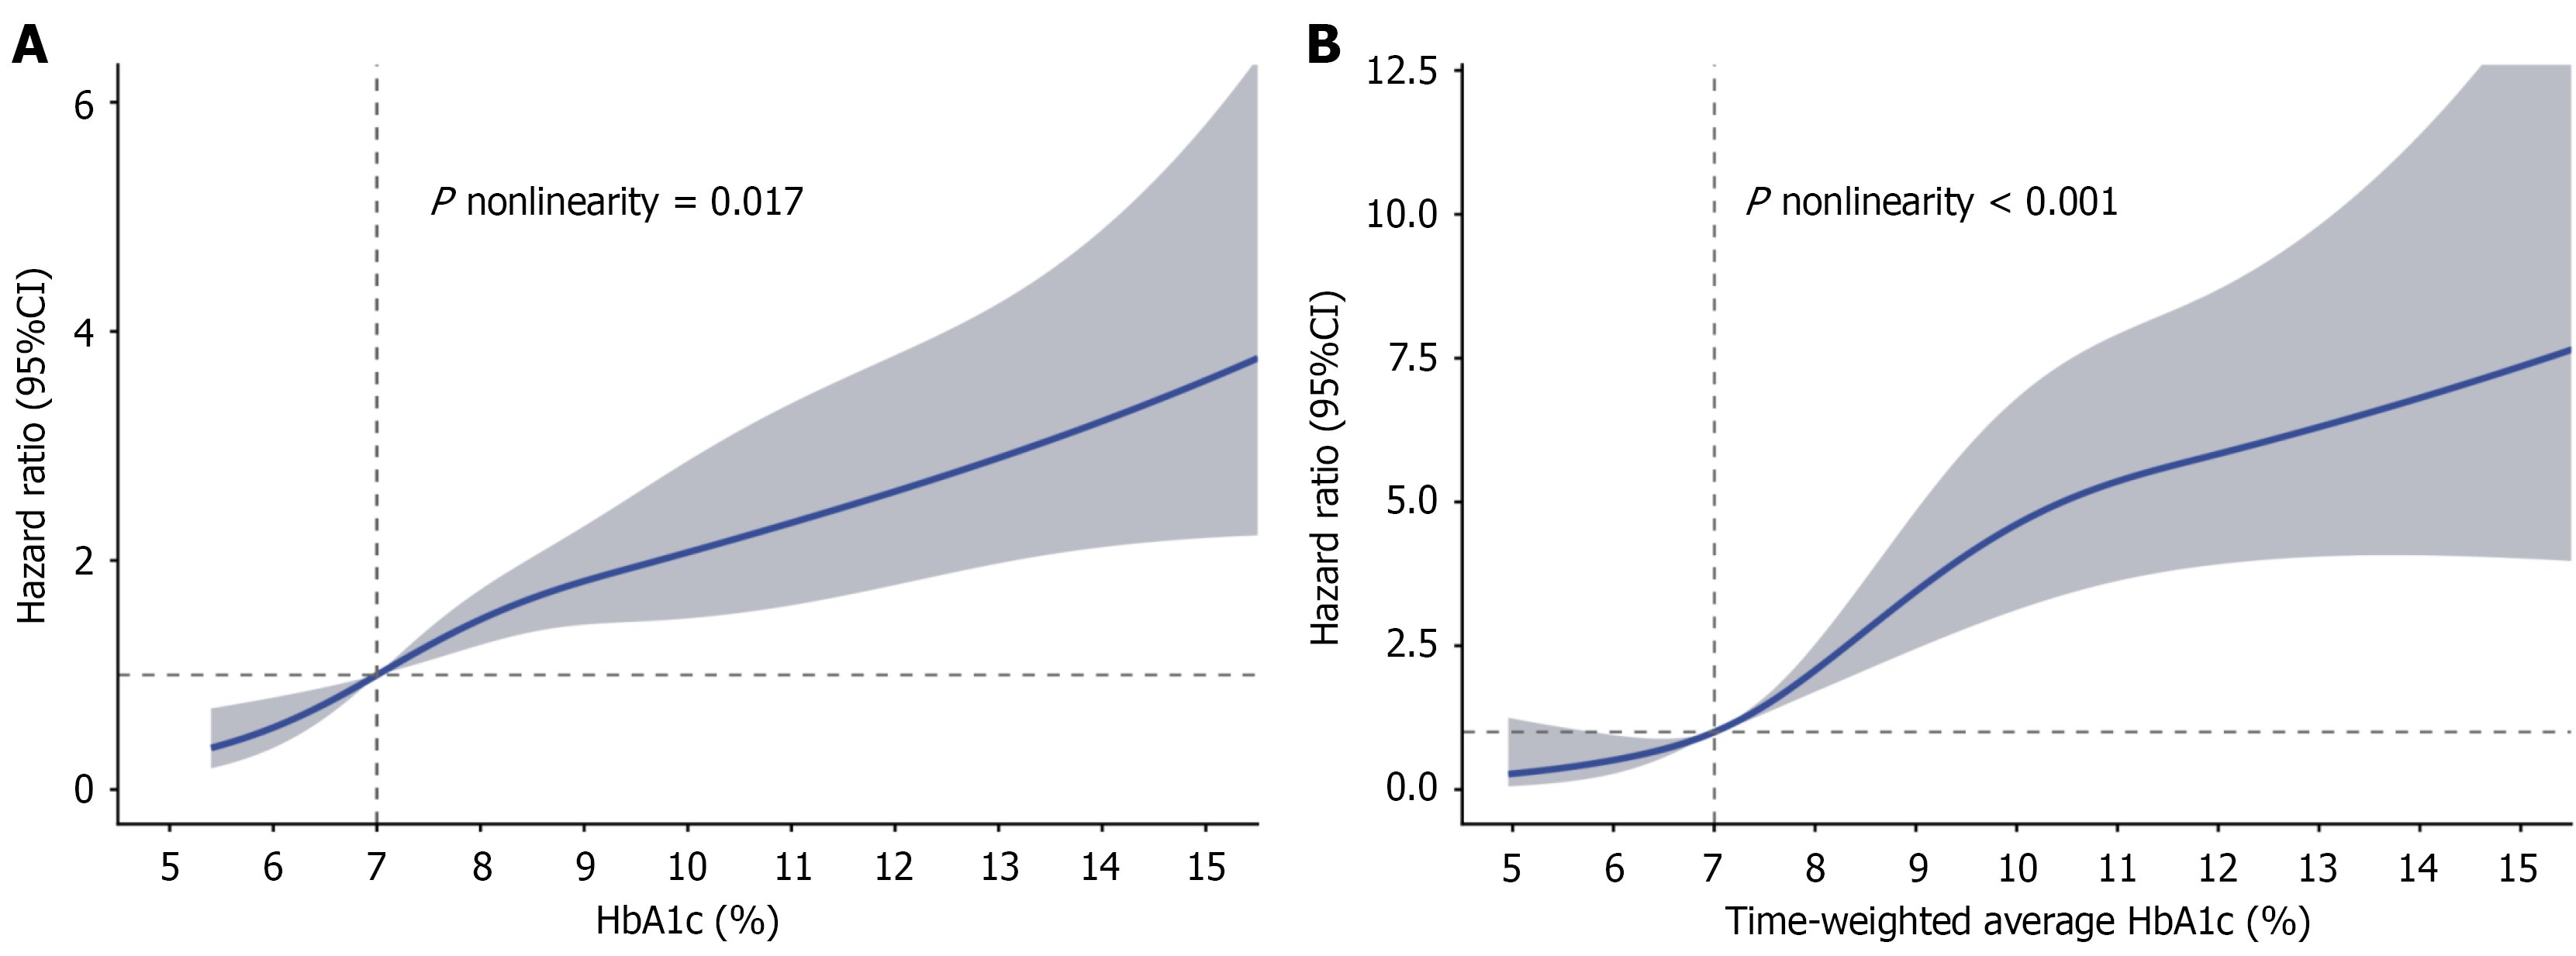
Figure 2 Restricted cubic spline curves for the association of glycated hemoglobin with the risk of incident diabetic kidney disease.
A: Baseline glycated hemoglobin (HbA1c); B: Time-weighted average HbA1c. The solid blue lines indicate the estimated hazard ratios, and the shaded regions represent the 95% confidence intervals. The models were fully adjusted for age, sex, body mass index, hypertension, major adverse cardiovascular and cerebrovascular events, hyperlipidemia, angiotensin-converting enzyme inhibitor/angiotensin II receptor blocker treatment, diabetes duration, blood urea nitrogen, creatinine, uric acid, low-density lipoprotein cholesterol, lipoprotein(a), urinary albumin-to-creatinine ratio, and measurement intensity. The vertical dashed line indicates the inflection point. The horizontal dashed lines represent the reference hazard ratio of 1.0. HbA1c: Glycated hemoglobin; CI: Confidence interval.
- Citation: Zou HY, Jiang H, Guo XD, Wen ZY, Shi Y, Zhou AD, Wang MM, Xu F, Cai MY. Dynamic glycemic exposure and trajectory profiling for incident diabetic kidney disease: A longitudinal cohort study. World J Diabetes 2026; 17(6): 120343
- URL: https://www.wjgnet.com/1948-9358/full/v17/i6/120343.htm
- DOI: https://dx.doi.org/10.4239/wjd.120343