
















Copyright: ©Author(s) 2026.
World J Diabetes. Jun 15, 2026; 17(6): 120010
Published online Jun 15, 2026. doi: 10.4239/wjd.120010
Published online Jun 15, 2026. doi: 10.4239/wjd.120010
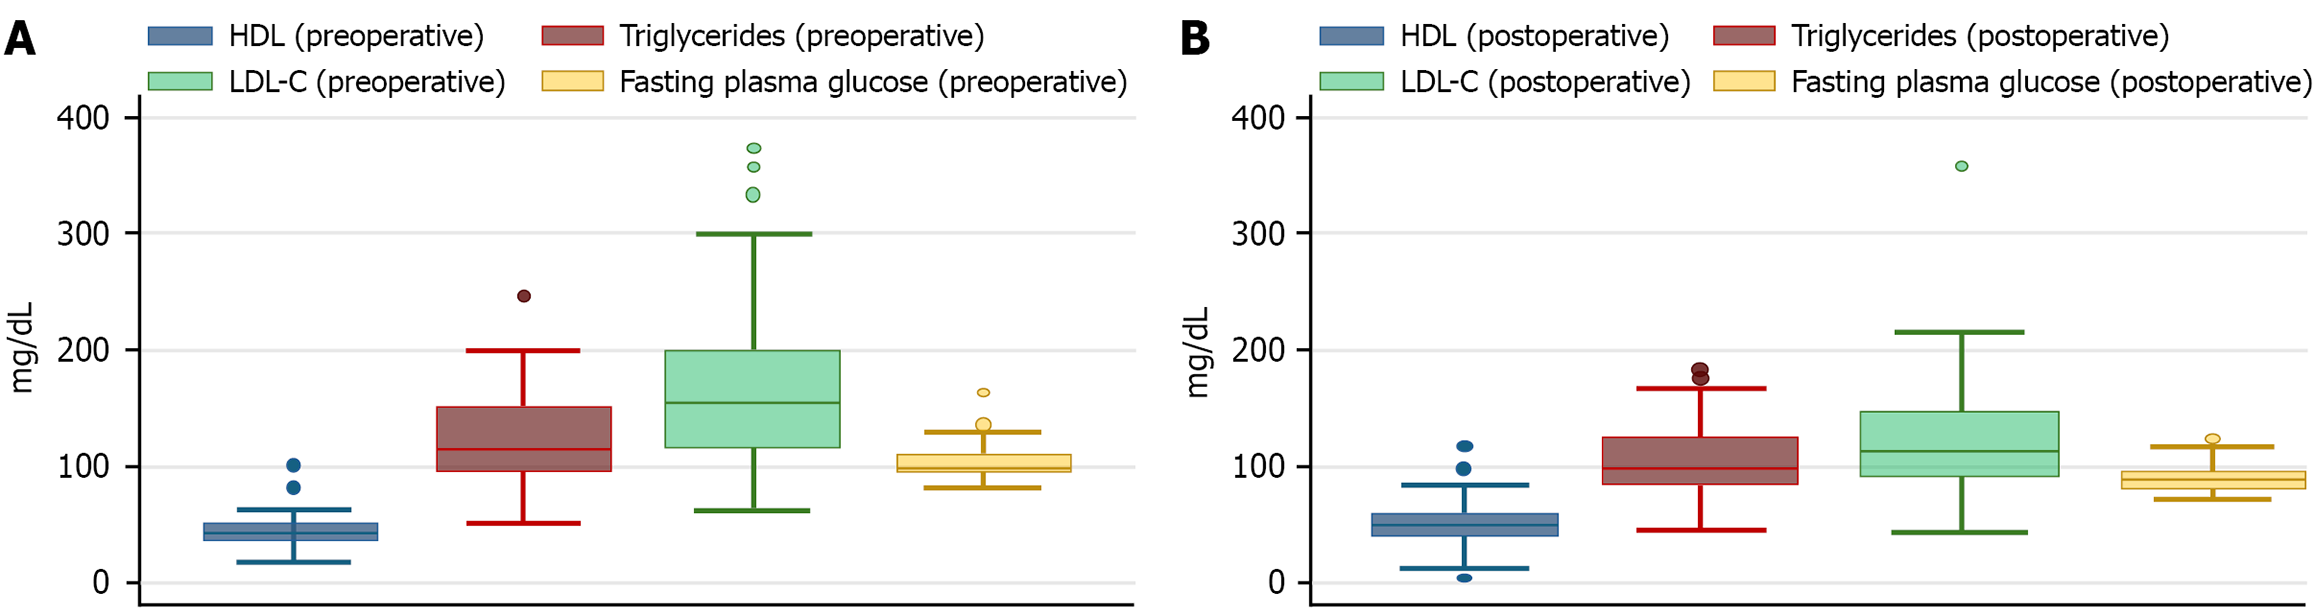
Figure 3 Changes in lipid profile before and after bariatric surgery in the overall cohort.
A: Preoperative lipid profile in overall cohort; B: Postoperative lipid profile in overall cohort. Box plots show the distribution of body mass index values in the preoperative period and during postoperative follow-up. The boxes represent the interquartile range, the horizontal line within each box indicates the median, whiskers represent the range excluding outliers, and dots indicate outlier values. HDL: High-density lipoprotein; LDL-C: Low-density lipoprotein cholesterol.
- Citation: Cisneros MA, Portilla N, Rincon O, Uscategui C, Alvarez M, Guzman I, Parra D, Llanos C, Romero I. Improvement in glycemic control after bariatric surgery beyond weight loss. World J Diabetes 2026; 17(6): 120010
- URL: https://www.wjgnet.com/1948-9358/full/v17/i6/120010.htm
- DOI: https://dx.doi.org/10.4239/wjd.120010