
















Copyright: ©Author(s) 2026.
World J Diabetes. Jun 15, 2026; 17(6): 120010
Published online Jun 15, 2026. doi: 10.4239/wjd.120010
Published online Jun 15, 2026. doi: 10.4239/wjd.120010
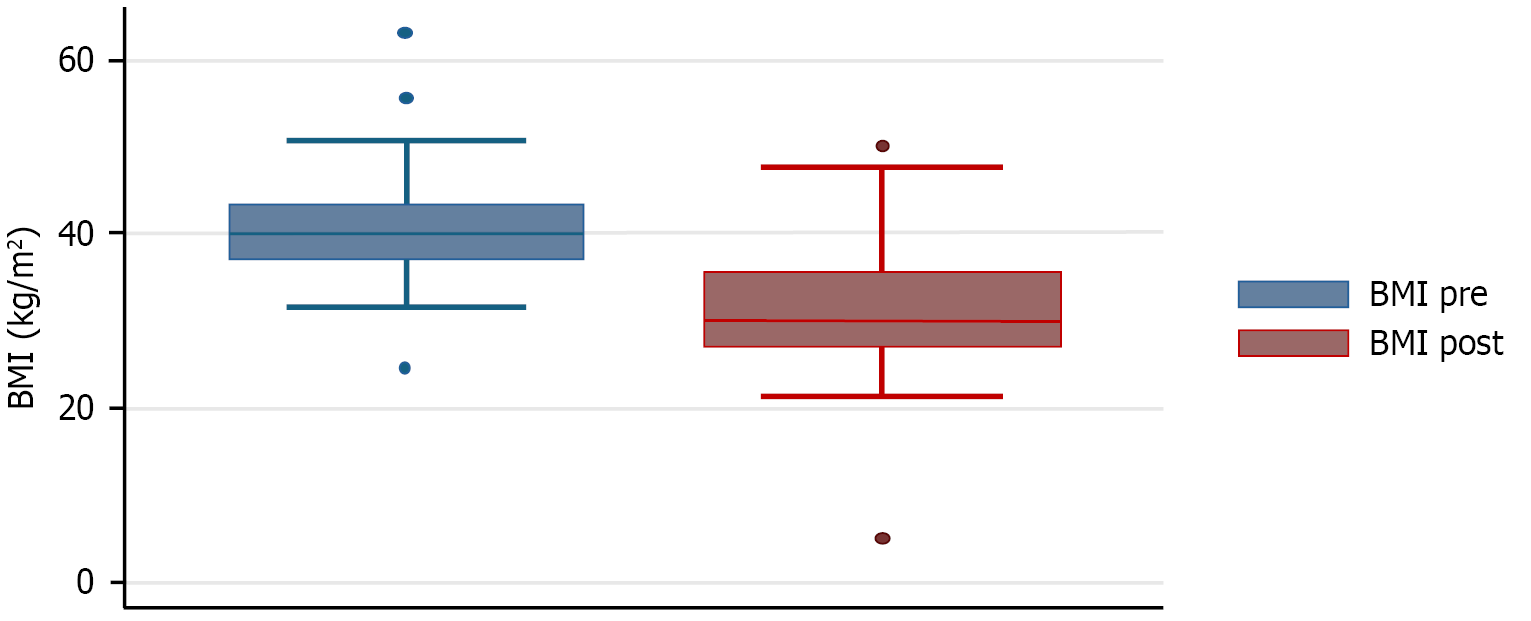
Figure 2 Changes in body mass index before and after bariatric surgery in the overall cohort.
Box plots show the distribution of body mass index values in the preoperative period and during postoperative follow-up. The boxes represent the interquartile range, the horizontal line within each box indicates the median, whiskers represent the range excluding outliers, and dots indicate outlier values. BMI: Body mass index.
- Citation: Cisneros MA, Portilla N, Rincon O, Uscategui C, Alvarez M, Guzman I, Parra D, Llanos C, Romero I. Improvement in glycemic control after bariatric surgery beyond weight loss. World J Diabetes 2026; 17(6): 120010
- URL: https://www.wjgnet.com/1948-9358/full/v17/i6/120010.htm
- DOI: https://dx.doi.org/10.4239/wjd.120010