
















Copyright: ©Author(s) 2026.
World J Diabetes. Jun 15, 2026; 17(6): 119913
Published online Jun 15, 2026. doi: 10.4239/wjd.119913
Published online Jun 15, 2026. doi: 10.4239/wjd.119913
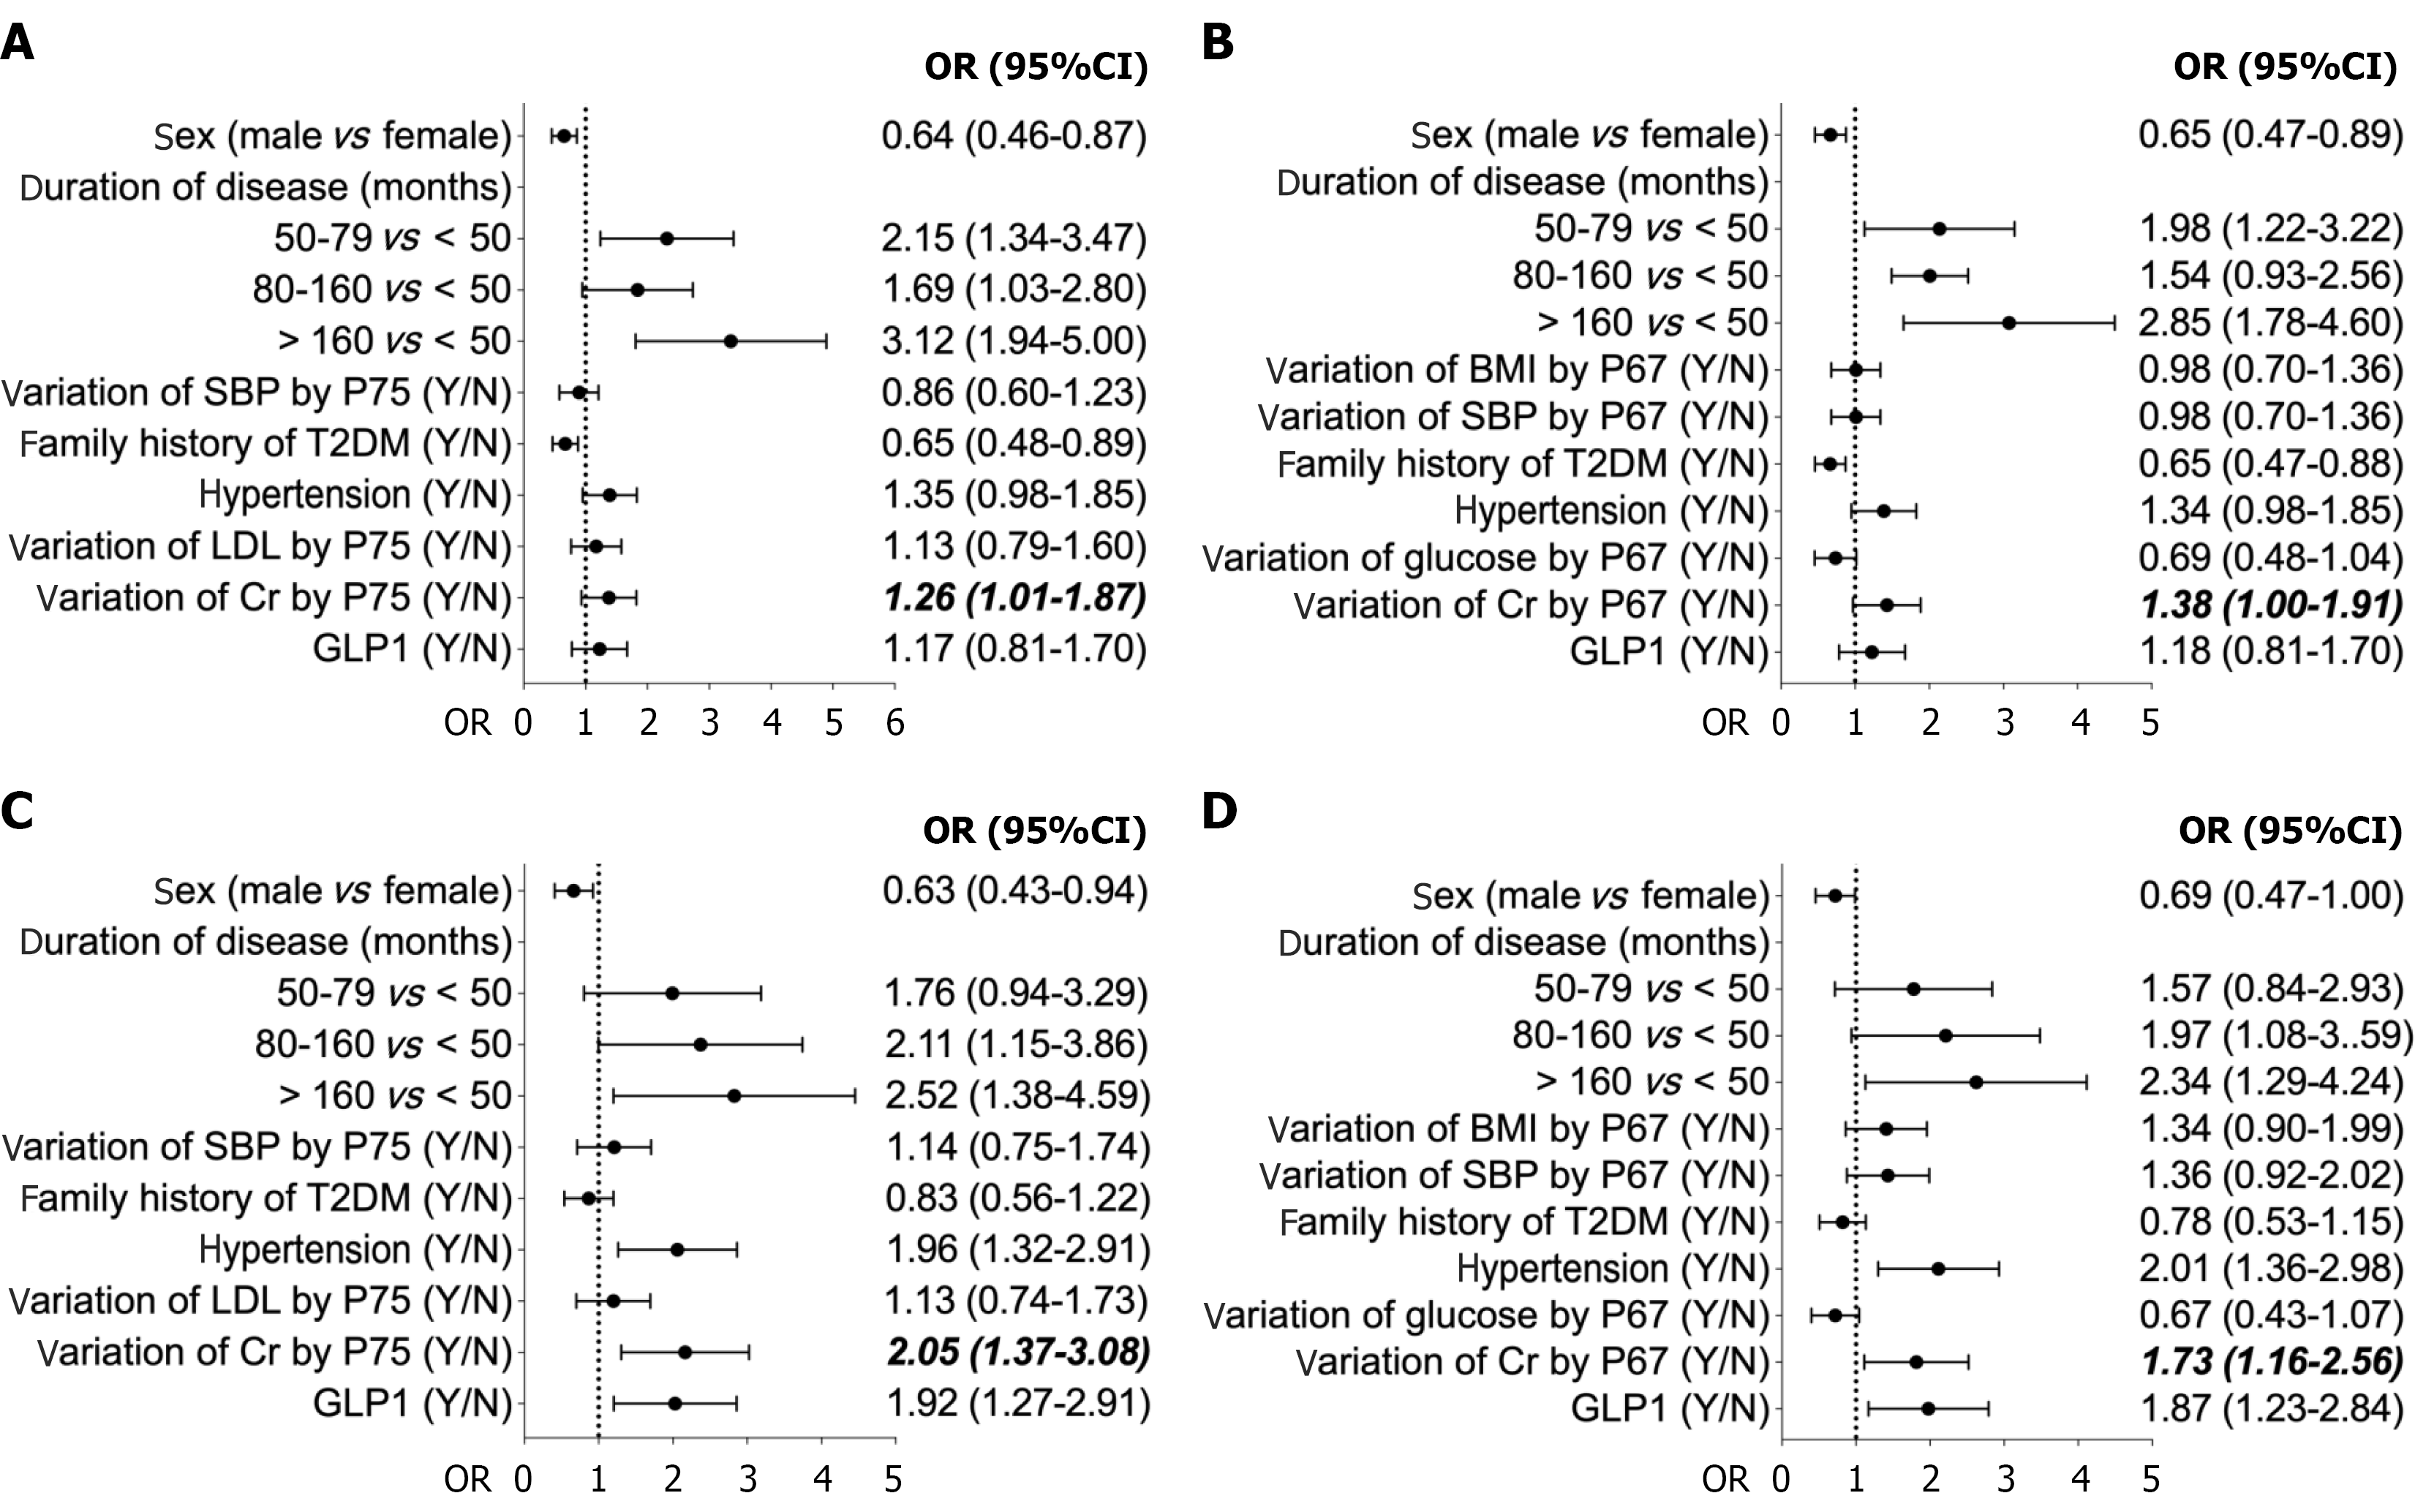
Figure 3 Subgroup analysis among type 2 diabetes mellitus patients with proteinuria progression identified by urinary albumin-to-creatinine ratio (changed from 30 to 30-299) or (changed from 30-299 to > 300) based on multivariable logistic regression by different variation of metabolic indexes, which was calculated by the percentiles (percentiles 75 and percentiles 67) of their standard deviation among type 2 diabetes mellitus patients.
A: Type 2 diabetes mellitus (T2DM) patients with proteinuria progression based on albumin-to-creatinine ratio (ACR) (from < 30 to 30-299) by 75 percentiles of SD; B: T2DM patients with proteinuria progression based on ACR (from < 30 to 30-299) by 67 percentile of SD; C: T2DM patients with proteinuria progression based on ACR (from 30-299 to > 300) by 75 percentile of SD; D: T2DM patients with proteinuria progression based on ACR (from 30-299 to > 300) by 67 percentile of SD. OR: Odds ratios; CI: Confidence intervals; BMI: Body mass index; SBP: Systolic blood pressure; T2DM: Type 2 diabetes mellitus; LDL: Low-density lipoprotein; Cr: Creatinine; GLP-1: Glucagon-like peptide 1; Y: Yes; N: No; P: Percentiles.
- Citation: Ma YH, Wei XH, Liu Y, Gu LP, Shen TT, Fan TT, Qin Q, Zhang AF, Wang RP, Wang YF. Visit-to-visit variability of creatinine levels associated with proteinuria progression in Chinese patients with type 2 diabetes mellitus. World J Diabetes 2026; 17(6): 119913
- URL: https://www.wjgnet.com/1948-9358/full/v17/i6/119913.htm
- DOI: https://dx.doi.org/10.4239/wjd.119913