
















Copyright: ©Author(s) 2026.
World J Diabetes. Jun 15, 2026; 17(6): 118650
Published online Jun 15, 2026. doi: 10.4239/wjd.118650
Published online Jun 15, 2026. doi: 10.4239/wjd.118650
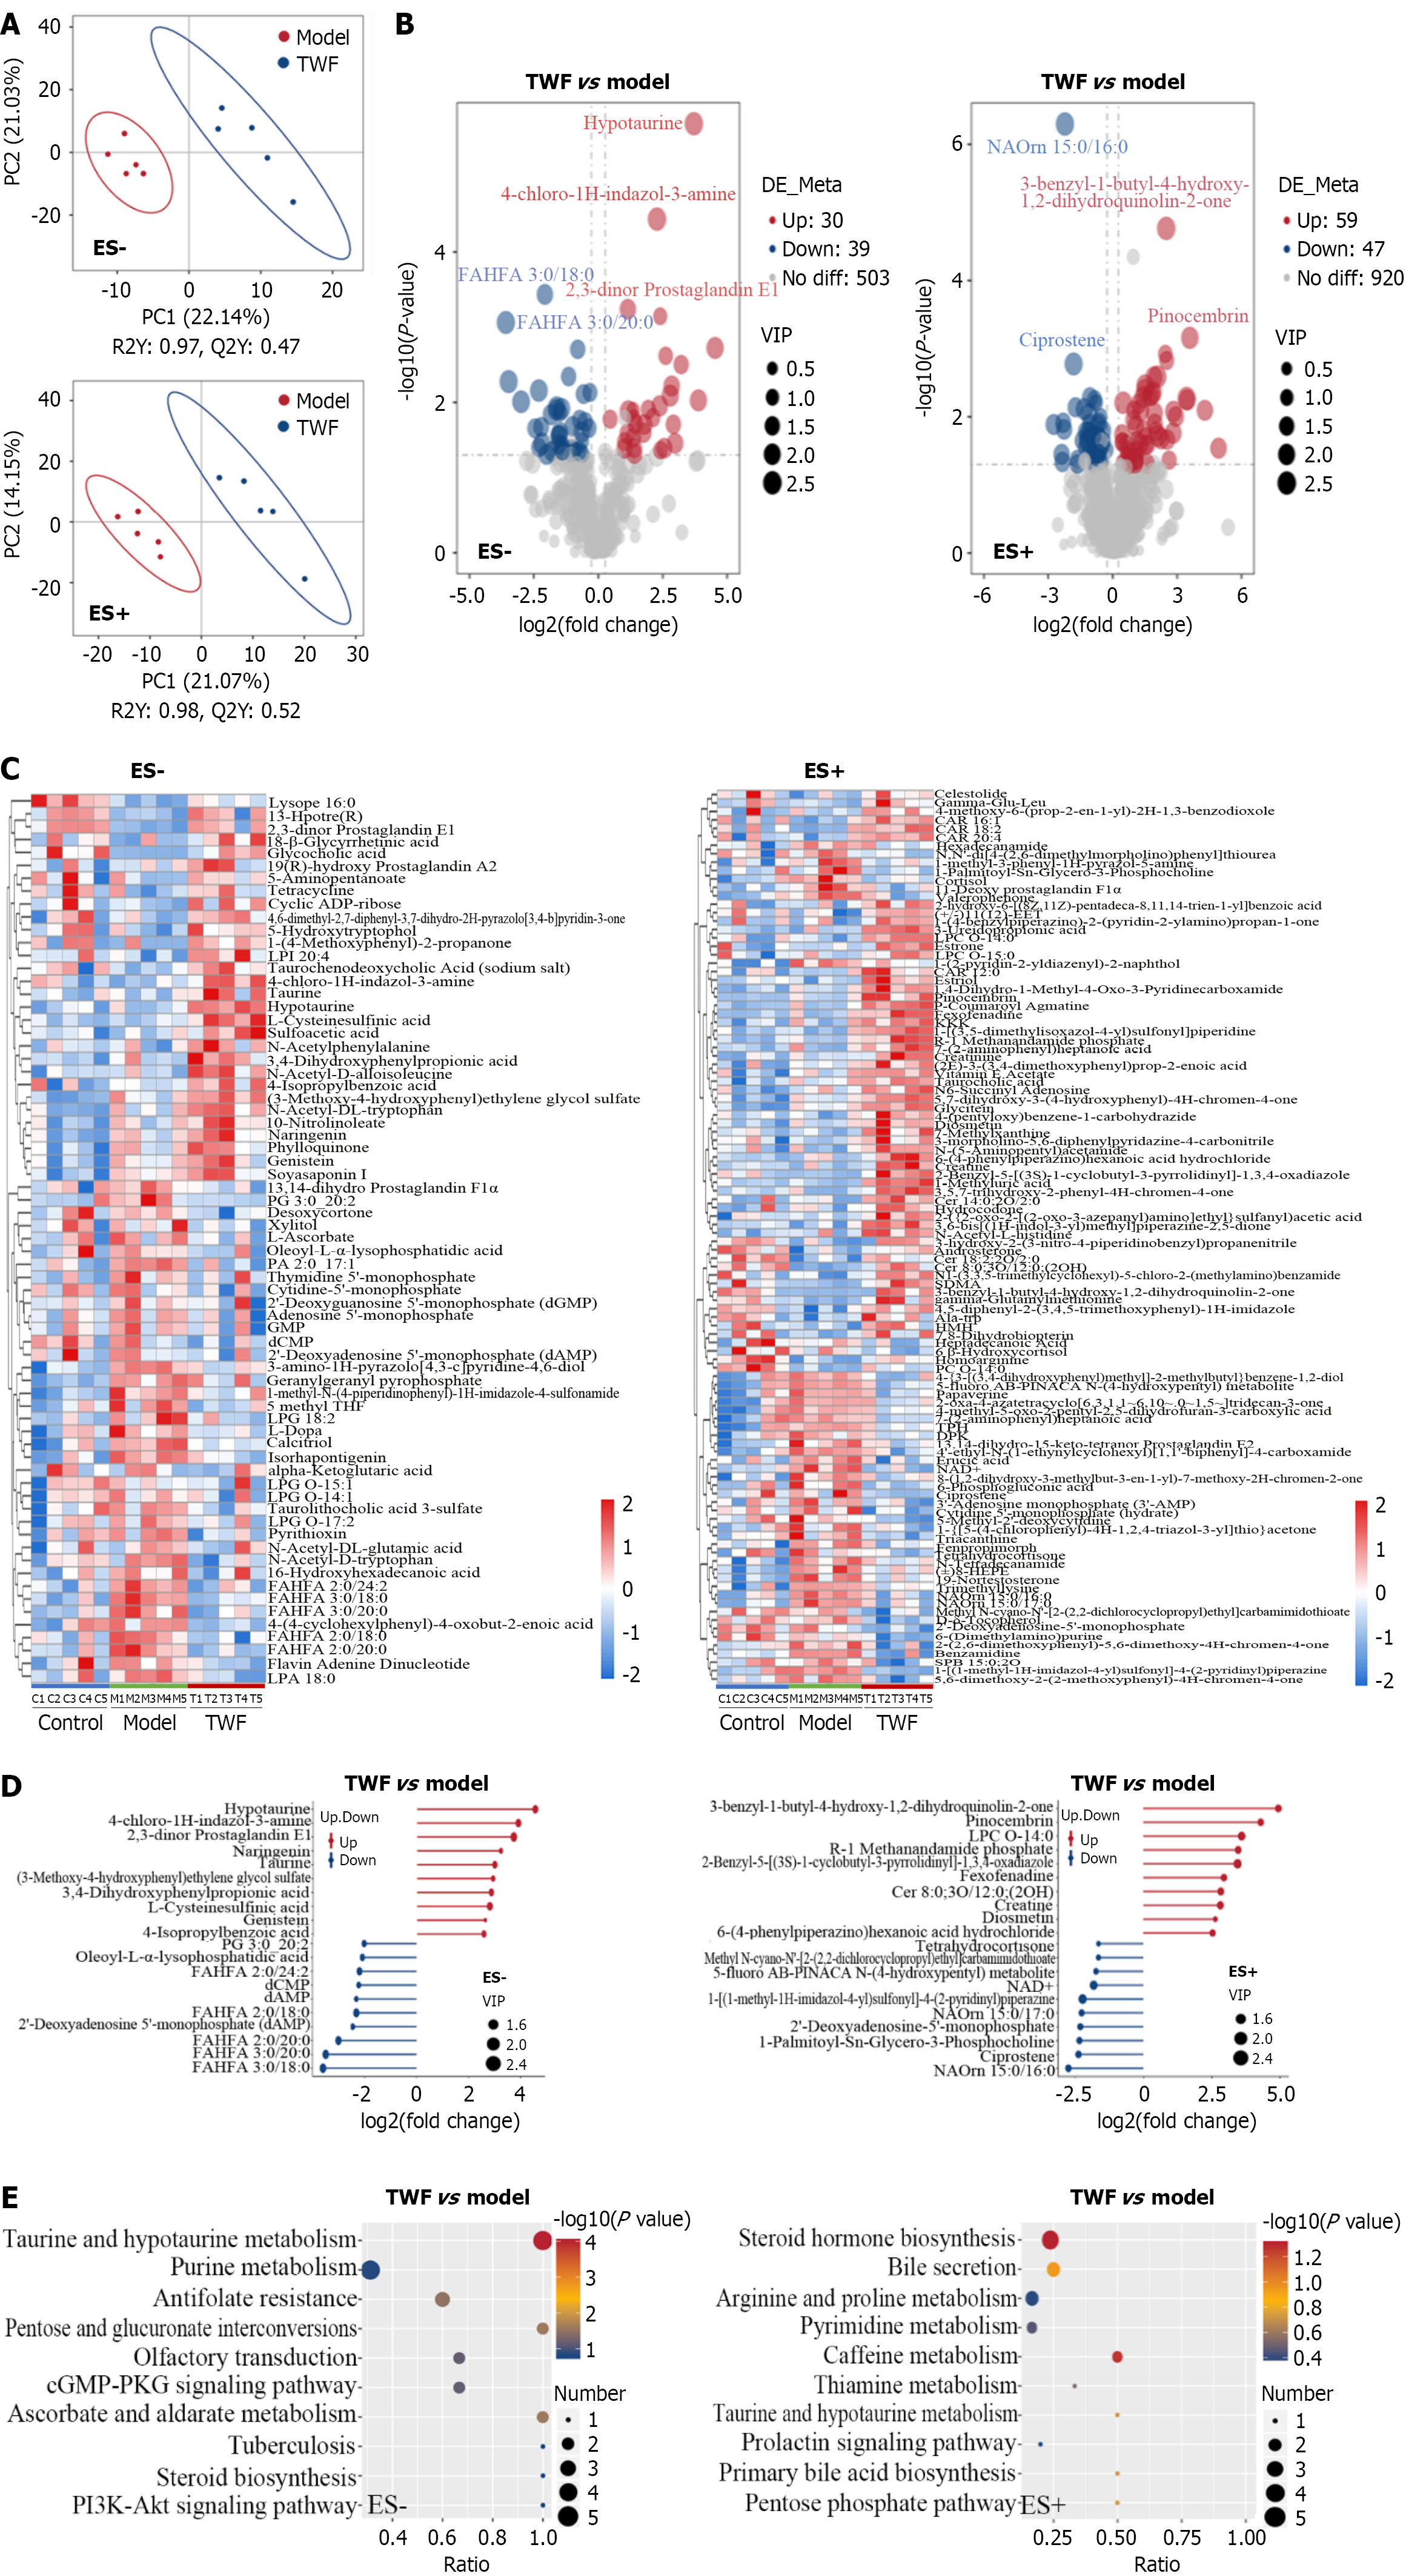
Figure 10 Tangwang formula changed the metabolic profiles of intestinal bacteria (n = 5).
A: Plots of partial least squares discriminant analysis for negative (ES-) and positive (ES+) ions in the model and Tangwang formula (TWF) groups; B: Volcano plot of differentially expressed metabolites between TWF and model groups for ES- and ES+ ions. Red and blue circles indicate significantly up-regulated and down-regulated metabolites, respectively (|fold change| > 1.5, P < 0.05); C: Heatmap of 70 (ES- ion) and 106 (ES+ ion) metabolites among the three groups. The normalized abundance values are depicted visually, where red represents the up-regulated metabolites and blue represents the down-regulated metabolites, respectively; D: Differential metabolites (top 20) in TWF group compared with model group in the ES- and ES+ ions; E: Enriched Kyoto Encyclopedia of Genes and Genomes pathways of differential metabolites in ES- ion and ES+ ion. TWF: Tangwang formula.
- Citation: Zhang H, Xing JX, Yin YF, Li J, Jing CX, Liu SY, Yin JZ, Gao X, Liang ZG, Yuan TY, Su H, Li YQ, Wang ZY, Dong HS, Zhao DQ, Ying DS, Zhou ZW, Huang QX. Tangwang formula ameliorates diabetic retinopathy by inhibiting cell apoptosis and regulating the intestinal microbiota and metabolic profiles. World J Diabetes 2026; 17(6): 118650
- URL: https://www.wjgnet.com/1948-9358/full/v17/i6/118650.htm
- DOI: https://dx.doi.org/10.4239/wjd.118650