
















Copyright: ©Author(s) 2026.
World J Diabetes. Jun 15, 2026; 17(6): 118650
Published online Jun 15, 2026. doi: 10.4239/wjd.118650
Published online Jun 15, 2026. doi: 10.4239/wjd.118650
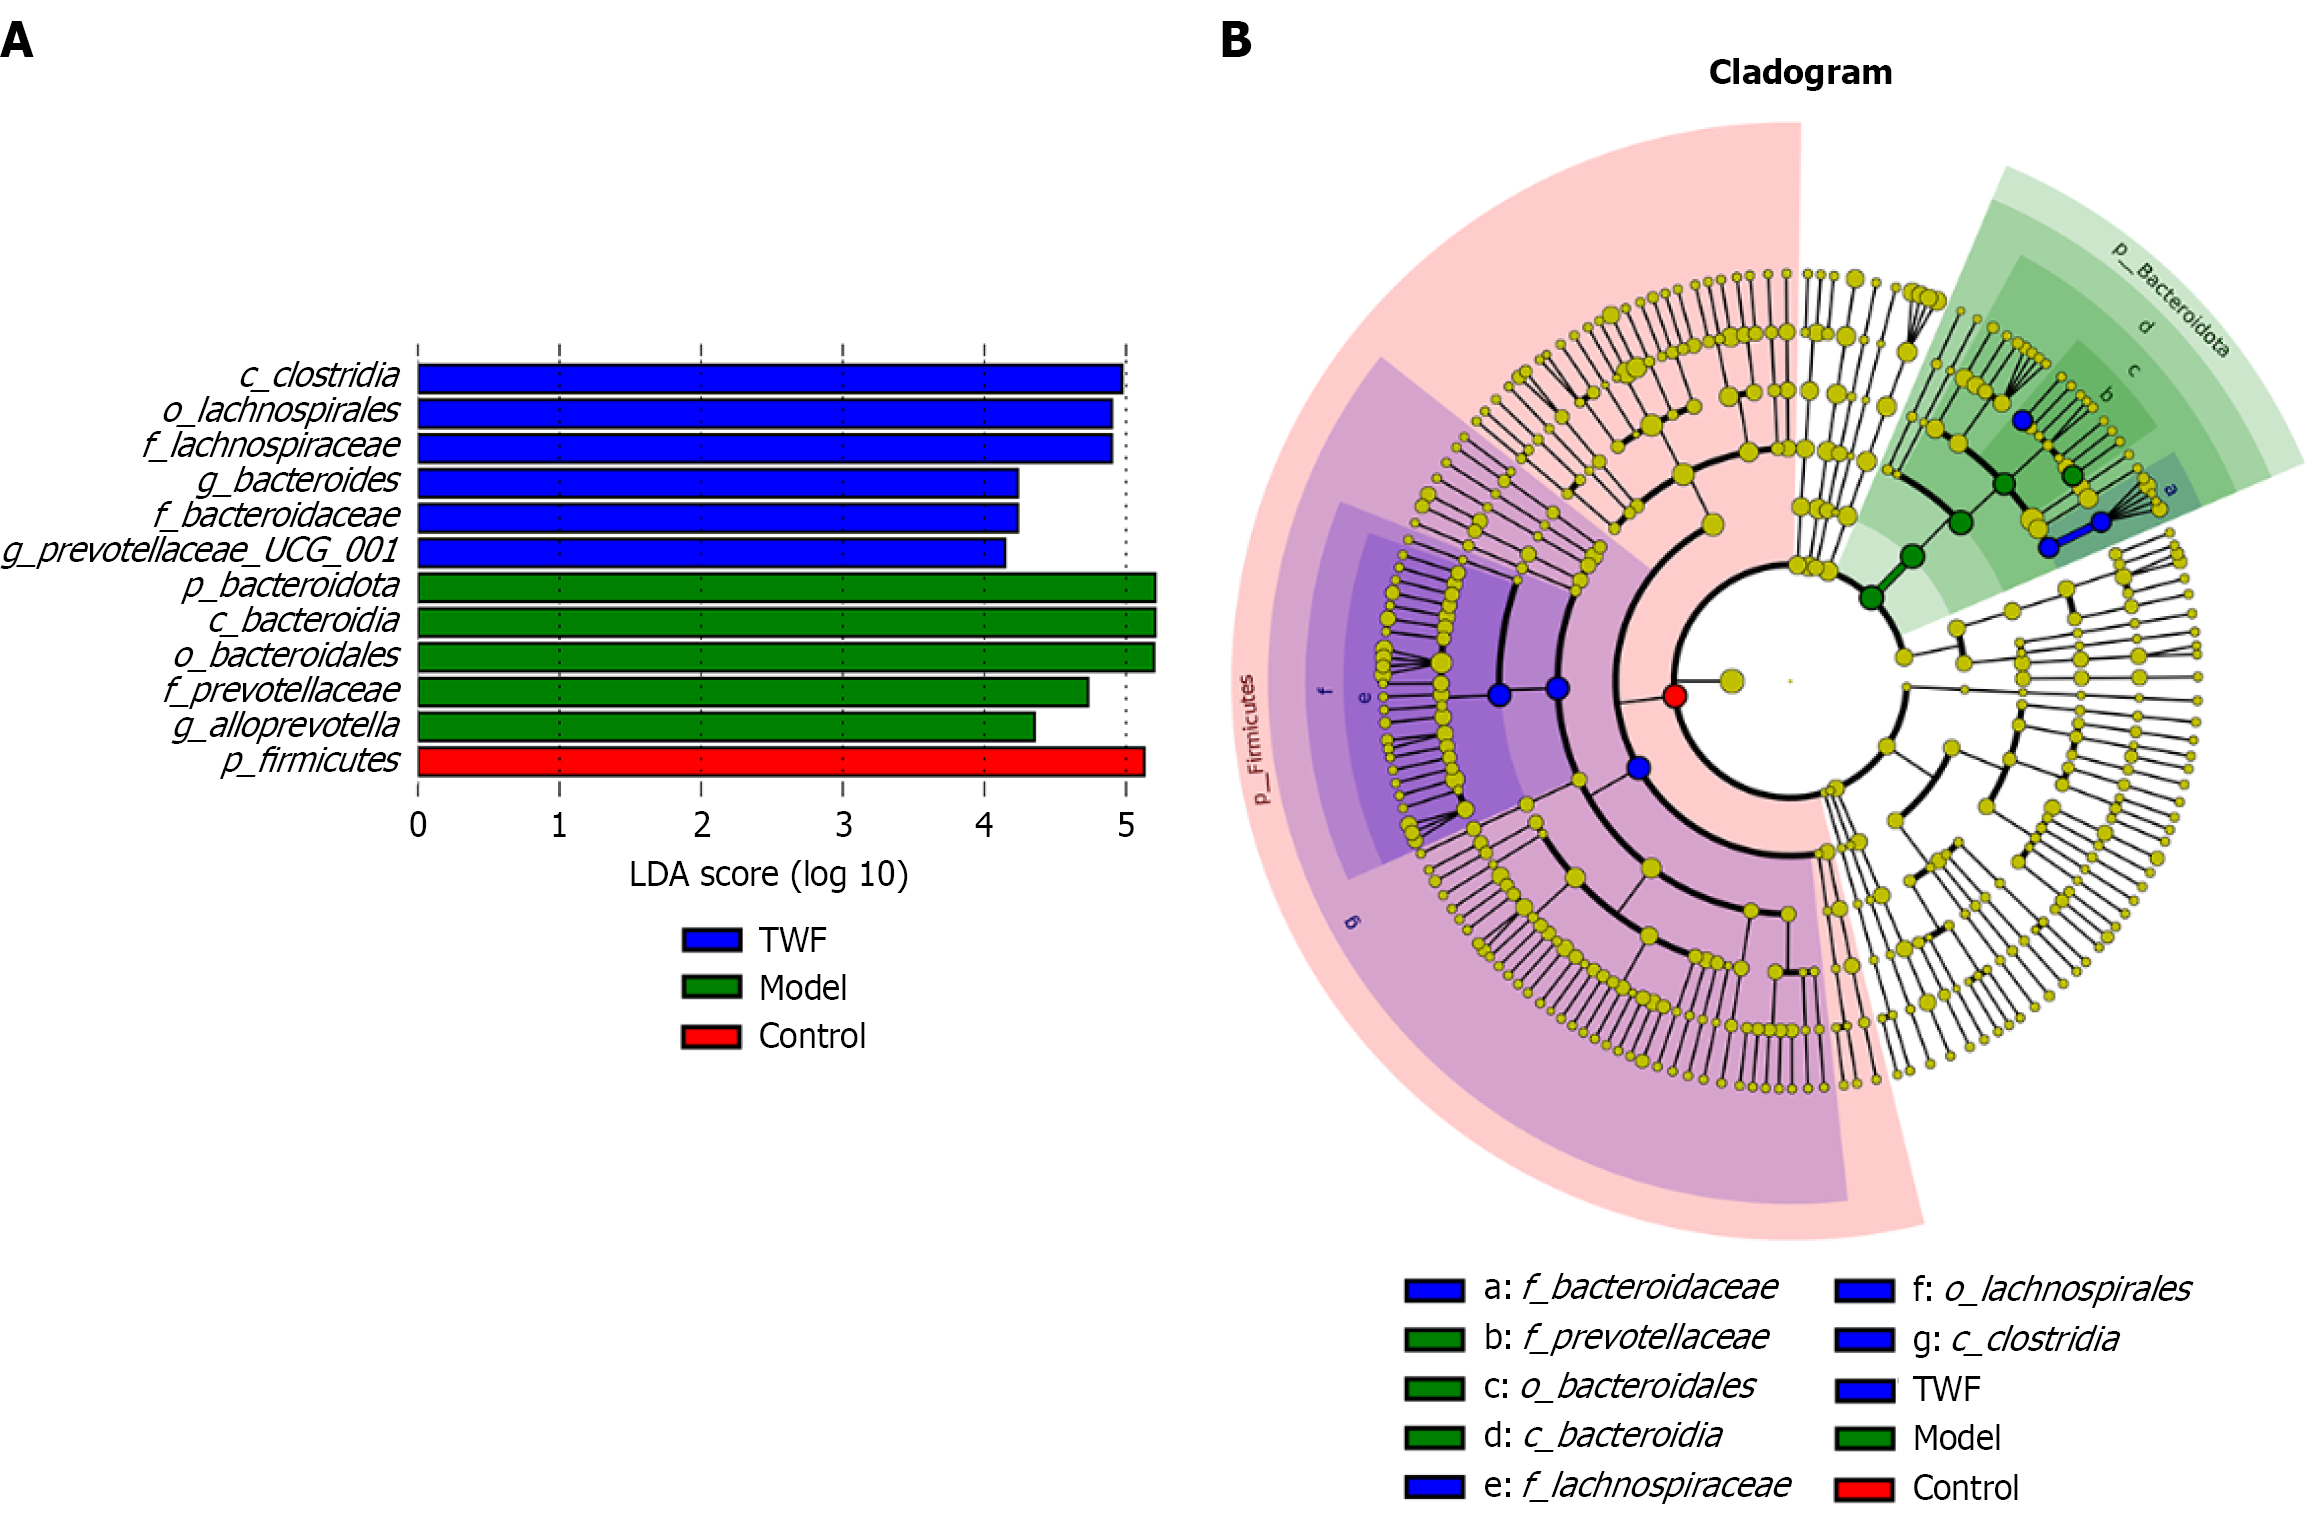
Figure 9 The LEfSe difference analysis of the relative abundance of intestinal microflora (n = 6).
A: Linear discriminative analysis scores; B: Taxonomic cladogram obtained from LEfSe sequence analysis. Biomarker taxa are highlighted by colored circles and shaded areas. Each circle reflects the abundance of taxa in the community (linear discriminative analysis Score > 4, Kruskal-Wallis test, false discovery rate, P < 0.05, p-phylum, c-class, o-order, f-family, g-genus). LDA: Linear discriminative analysis; TWF: Tangwang formula.
- Citation: Zhang H, Xing JX, Yin YF, Li J, Jing CX, Liu SY, Yin JZ, Gao X, Liang ZG, Yuan TY, Su H, Li YQ, Wang ZY, Dong HS, Zhao DQ, Ying DS, Zhou ZW, Huang QX. Tangwang formula ameliorates diabetic retinopathy by inhibiting cell apoptosis and regulating the intestinal microbiota and metabolic profiles. World J Diabetes 2026; 17(6): 118650
- URL: https://www.wjgnet.com/1948-9358/full/v17/i6/118650.htm
- DOI: https://dx.doi.org/10.4239/wjd.118650