
















Copyright: ©Author(s) 2026.
World J Diabetes. Jun 15, 2026; 17(6): 118650
Published online Jun 15, 2026. doi: 10.4239/wjd.118650
Published online Jun 15, 2026. doi: 10.4239/wjd.118650
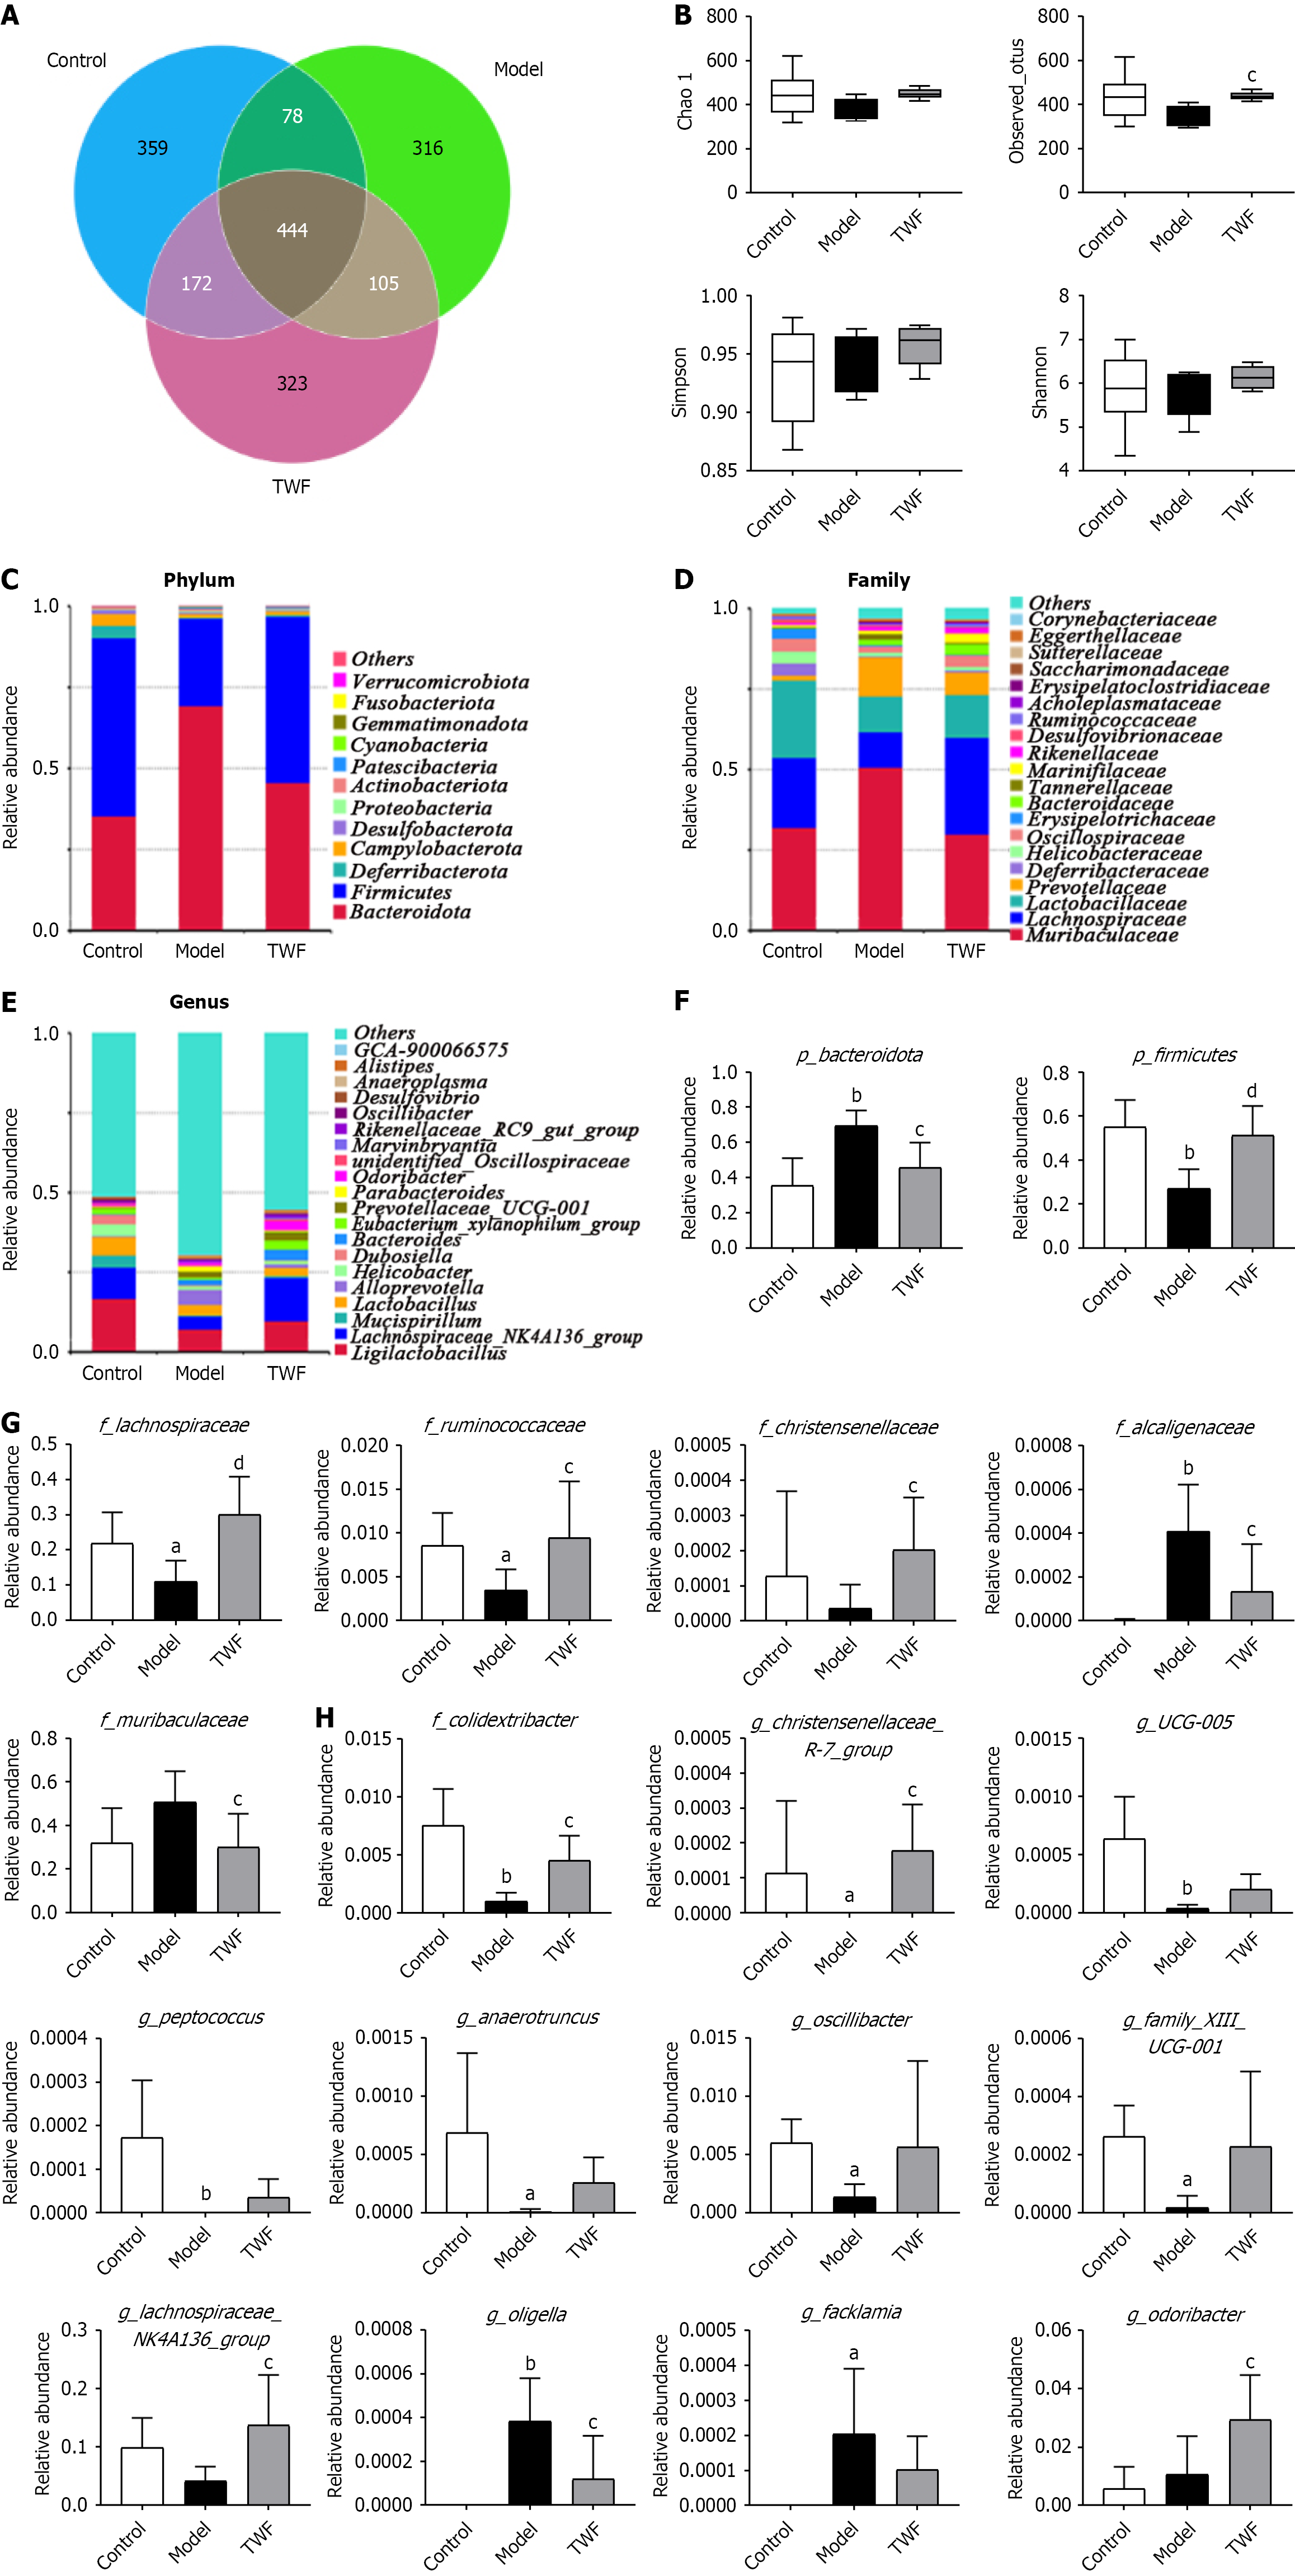
Figure 8 Effect of Tangwang formula on the composition of intestinal bacteria (n = 6).
A: Venn diagram of overlap ASV among groups; B: Alpha-diversity of intestinal bacteria; C: The relative abundances of the top 12 bacteria at the phylum level; D: The relative abundances of the top 20 bacteria at the family level; E: The relative abundances of the top 20 bacteria at the genus level; F: The relative abundances of p_bacteroidota and p_firmicutes at the phylum level; G: The relative abundances of 5 bacteria at the family level; H: The relative abundances of 11 bacteria at the genus level (p-phylum, c-class, o-order, f-family, g-genus). The data are expressed as mean ± SD, aP < 0.05 vs control group, bP < 0.01 vs control group, cP < 0.05 vs model group, and dP < 0.01 vs model group. TWF: Tangwang formula.
- Citation: Zhang H, Xing JX, Yin YF, Li J, Jing CX, Liu SY, Yin JZ, Gao X, Liang ZG, Yuan TY, Su H, Li YQ, Wang ZY, Dong HS, Zhao DQ, Ying DS, Zhou ZW, Huang QX. Tangwang formula ameliorates diabetic retinopathy by inhibiting cell apoptosis and regulating the intestinal microbiota and metabolic profiles. World J Diabetes 2026; 17(6): 118650
- URL: https://www.wjgnet.com/1948-9358/full/v17/i6/118650.htm
- DOI: https://dx.doi.org/10.4239/wjd.118650