
















Copyright: ©Author(s) 2026.
World J Diabetes. May 15, 2026; 17(5): 118275
Published online May 15, 2026. doi: 10.4239/wjd.v17.i5.118275
Published online May 15, 2026. doi: 10.4239/wjd.v17.i5.118275
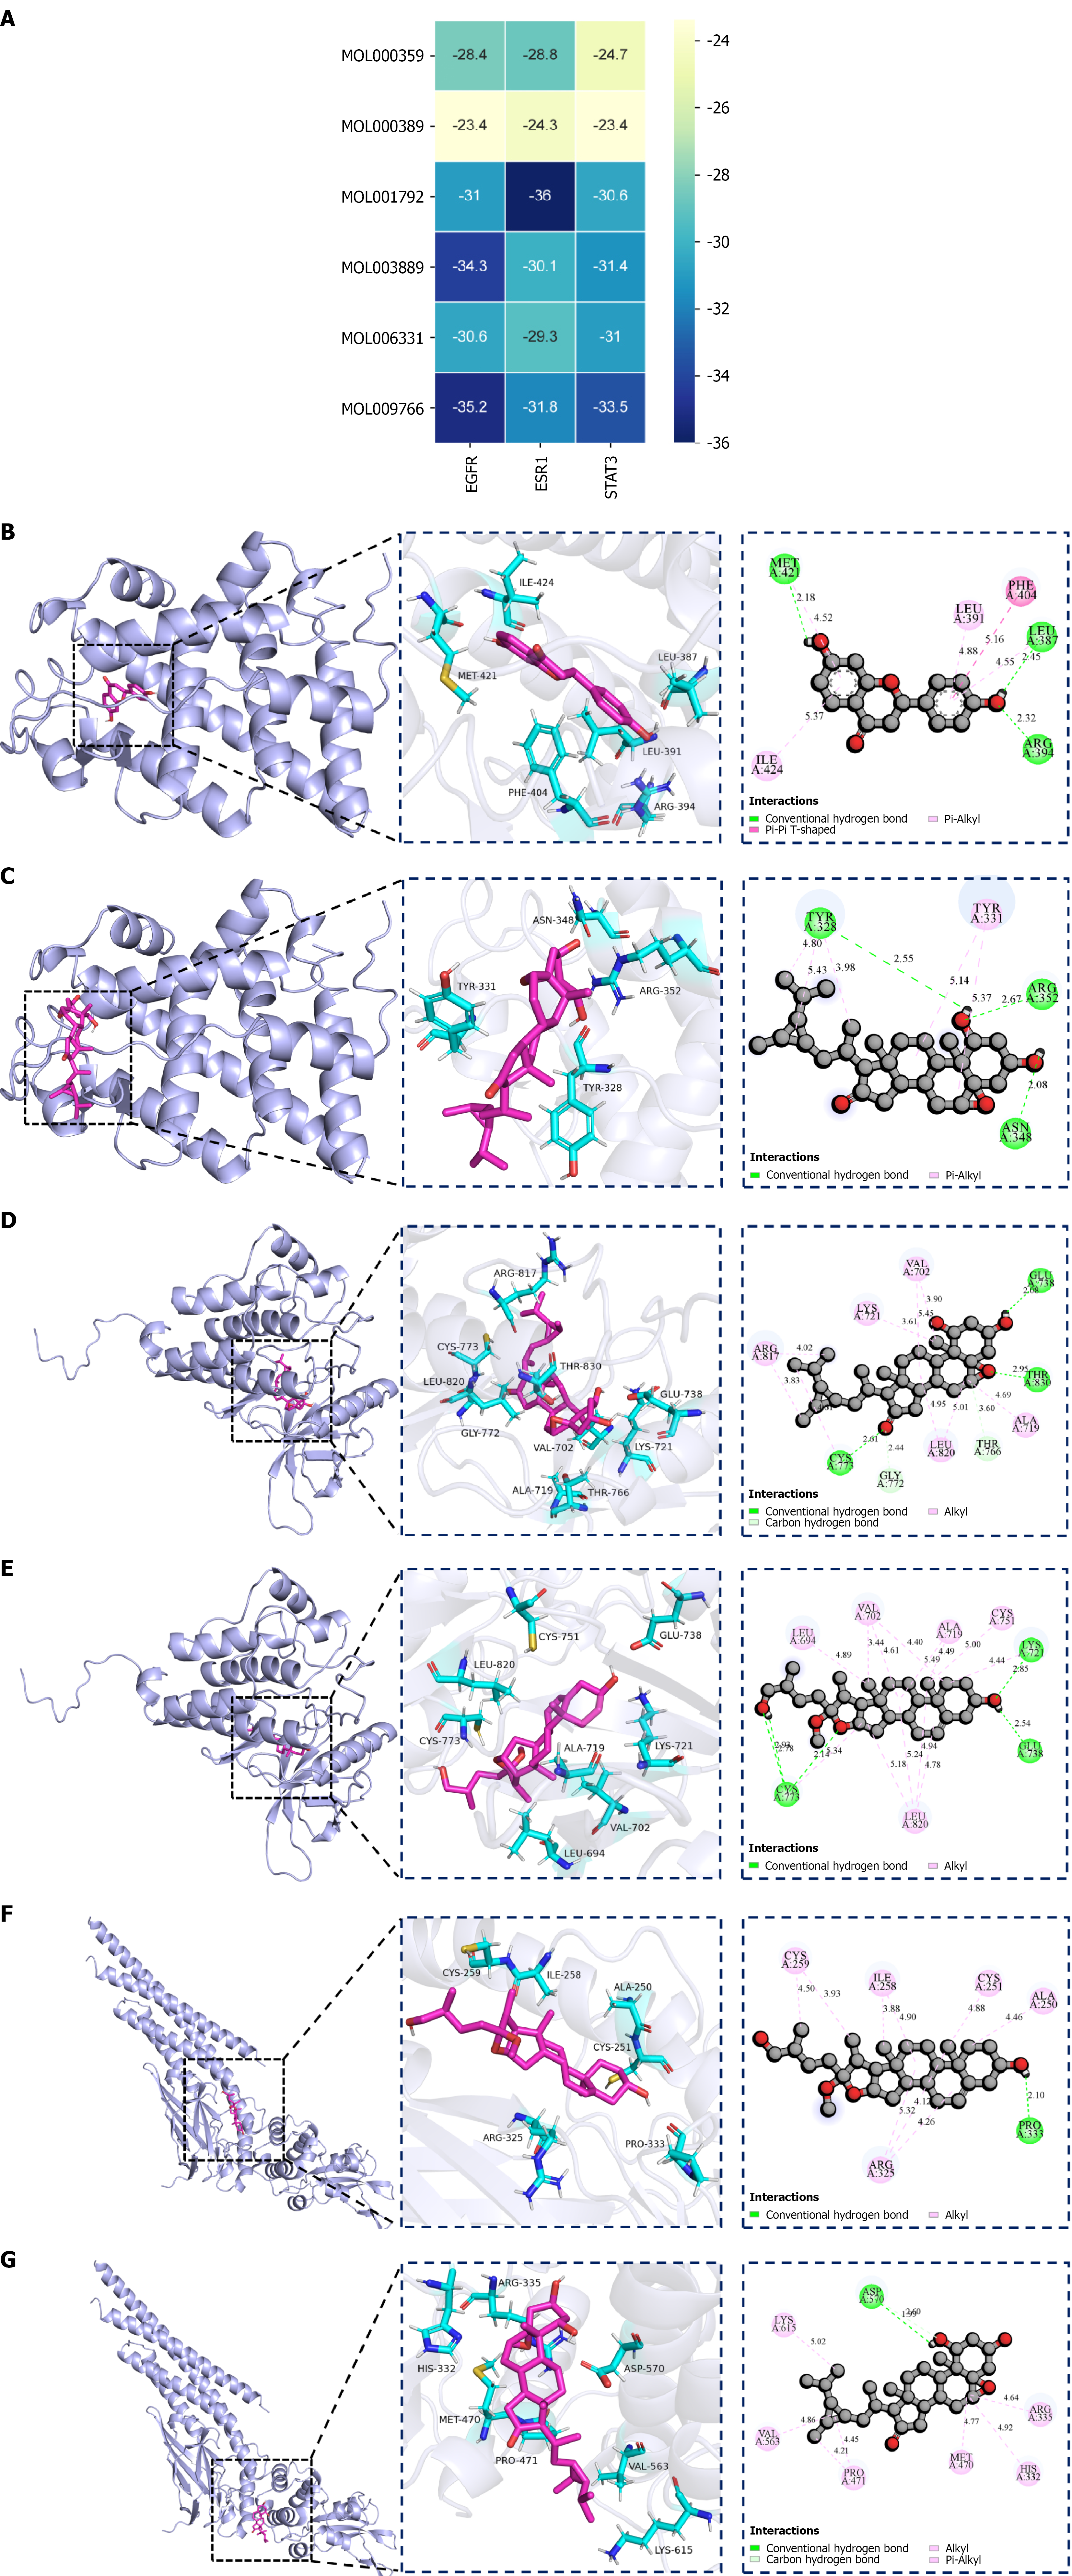
Figure 3 Molecular docking binding energies and the key active ingredient–core target pairs.
A: Heatmap of binding energies (kJ/mol) between 6 Danggui-Huangjing components (rows, MOL IDs) and 3 targets [columns: Epidermal growth factor receptor (EGFR)/estrogen receptor 1 (ESR1)/signal transducer and activator of transcription 3 (STAT3)]. Energies converted from kcal/mol (1 kcal/mol = 4.184 kJ/mol); more negative values = stronger binding; color gradient = affinity; B-G: Docking conformations (PyMOL 2.6.0) and two-dimensional chemical structure of the ligand [B: EGFR-zhonghualiaoine 1 (MOL009766); C: EGFR-methylprotodioscin_qt (MOL003889); D: STAT3-methylprotodioscin_qt (MOL003889); E: STAT3-zhonghualiaoine (MOL009766); F: ESR1-DFV (MOL001792); G: ESR1-zhonghualiaoine 1 (MOL009766)]. Docking via AutoDock 4.2.6 (semi-rigid); receptors (Protein Data Bank structures) processed by PyMOL 2.5.7 (ligands/water removed); binding pockets identified by Getbox Plugin.
- Citation: Li WJ, Xu JJ, Tiang HS, Liu TH, Wu LL. Network pharmacology: Anti-obesity and insulin-sensitizing effects of Danggui-Huangjing herb-pair via epidermal growth factor receptor/phosphatidylinositol 3-kinase/protein kinase B pathway. World J Diabetes 2026; 17(5): 118275
- URL: https://www.wjgnet.com/1948-9358/full/v17/i5/118275.htm
- DOI: https://dx.doi.org/10.4239/wjd.v17.i5.118275