
















Copyright: ©Author(s) 2026.
World J Diabetes. May 15, 2026; 17(5): 118275
Published online May 15, 2026. doi: 10.4239/wjd.v17.i5.118275
Published online May 15, 2026. doi: 10.4239/wjd.v17.i5.118275
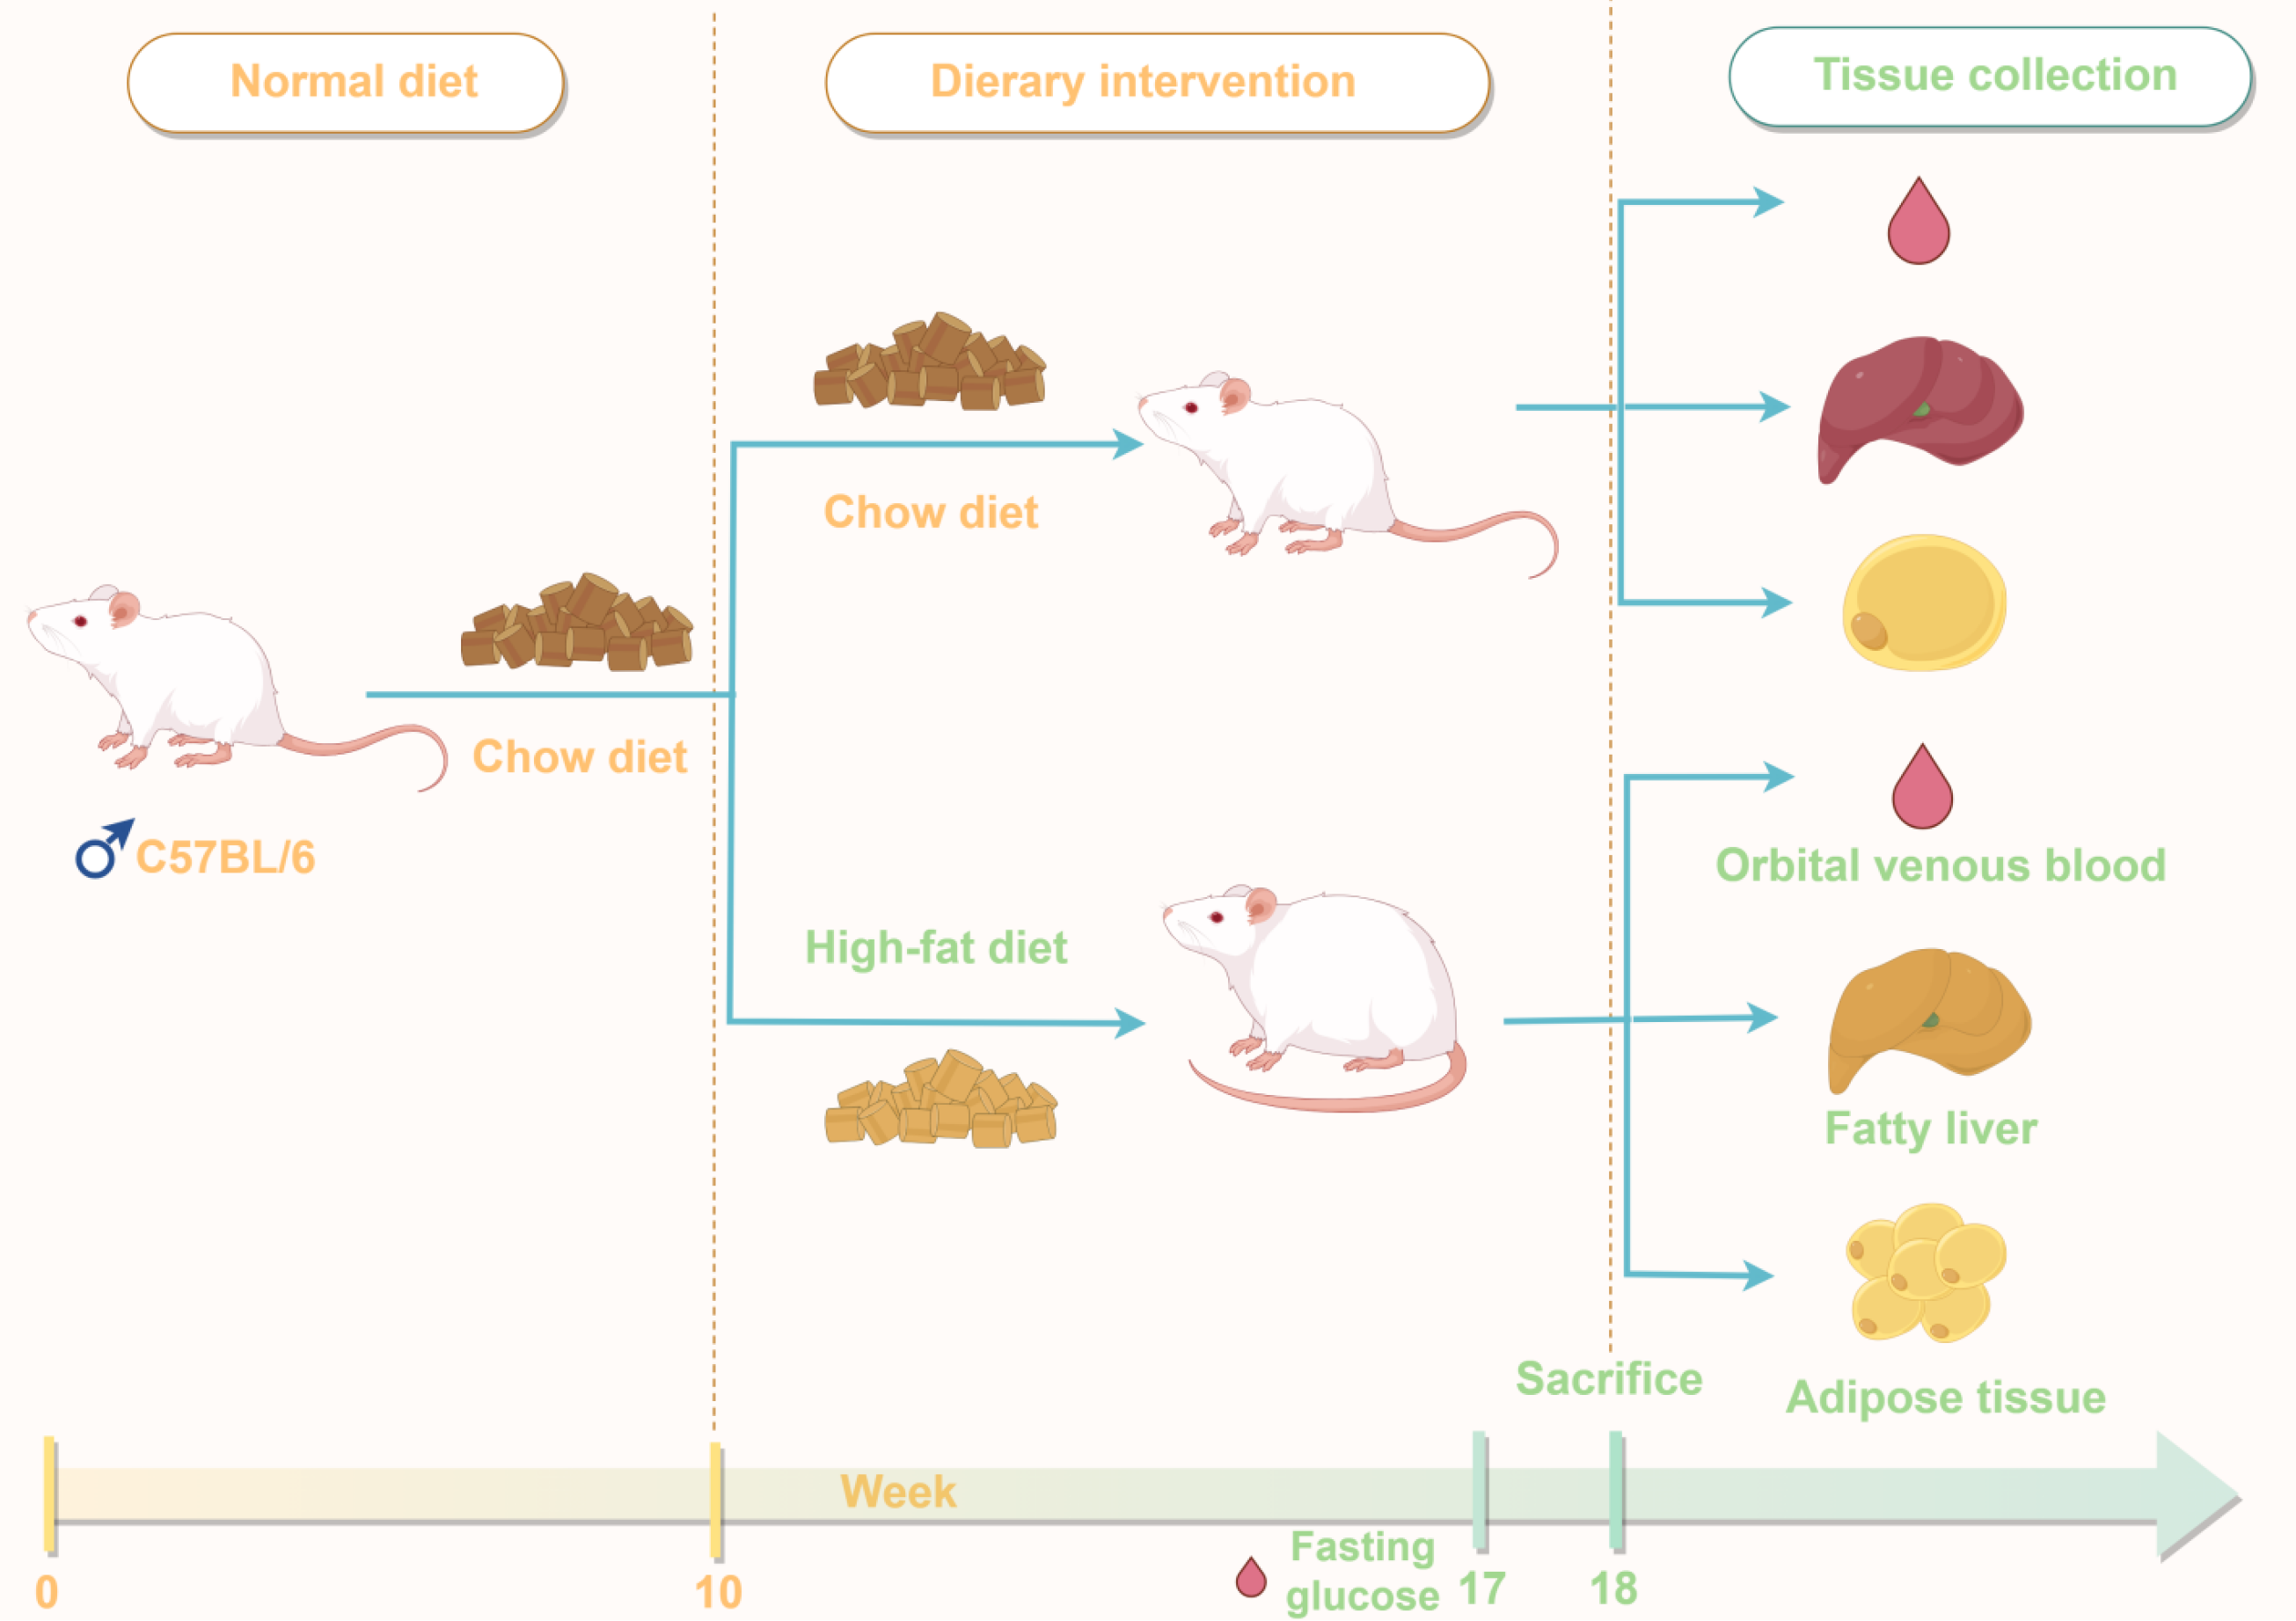
Figure 1 Schematic of the dietary intervention and sample collection timeline.
This diagram outlines the key timeline of the animal experiment. C57BL/6 mice were assigned to either a chow diet or high-fat diet regimen. Obesity was induced by high-fat diet feeding from week 0 to 10. Glucose assessment was performed at week 17. At week 18, mice were sacrificed after fasting, and orbital venous blood, fatty liver tissue, and adipose tissue were collected for subsequent analyses.
- Citation: Li WJ, Xu JJ, Tiang HS, Liu TH, Wu LL. Network pharmacology: Anti-obesity and insulin-sensitizing effects of Danggui-Huangjing herb-pair via epidermal growth factor receptor/phosphatidylinositol 3-kinase/protein kinase B pathway. World J Diabetes 2026; 17(5): 118275
- URL: https://www.wjgnet.com/1948-9358/full/v17/i5/118275.htm
- DOI: https://dx.doi.org/10.4239/wjd.v17.i5.118275