
















Copyright: ©Author(s) 2026.
World J Diabetes. May 15, 2026; 17(5): 117338
Published online May 15, 2026. doi: 10.4239/wjd.v17.i5.117338
Published online May 15, 2026. doi: 10.4239/wjd.v17.i5.117338
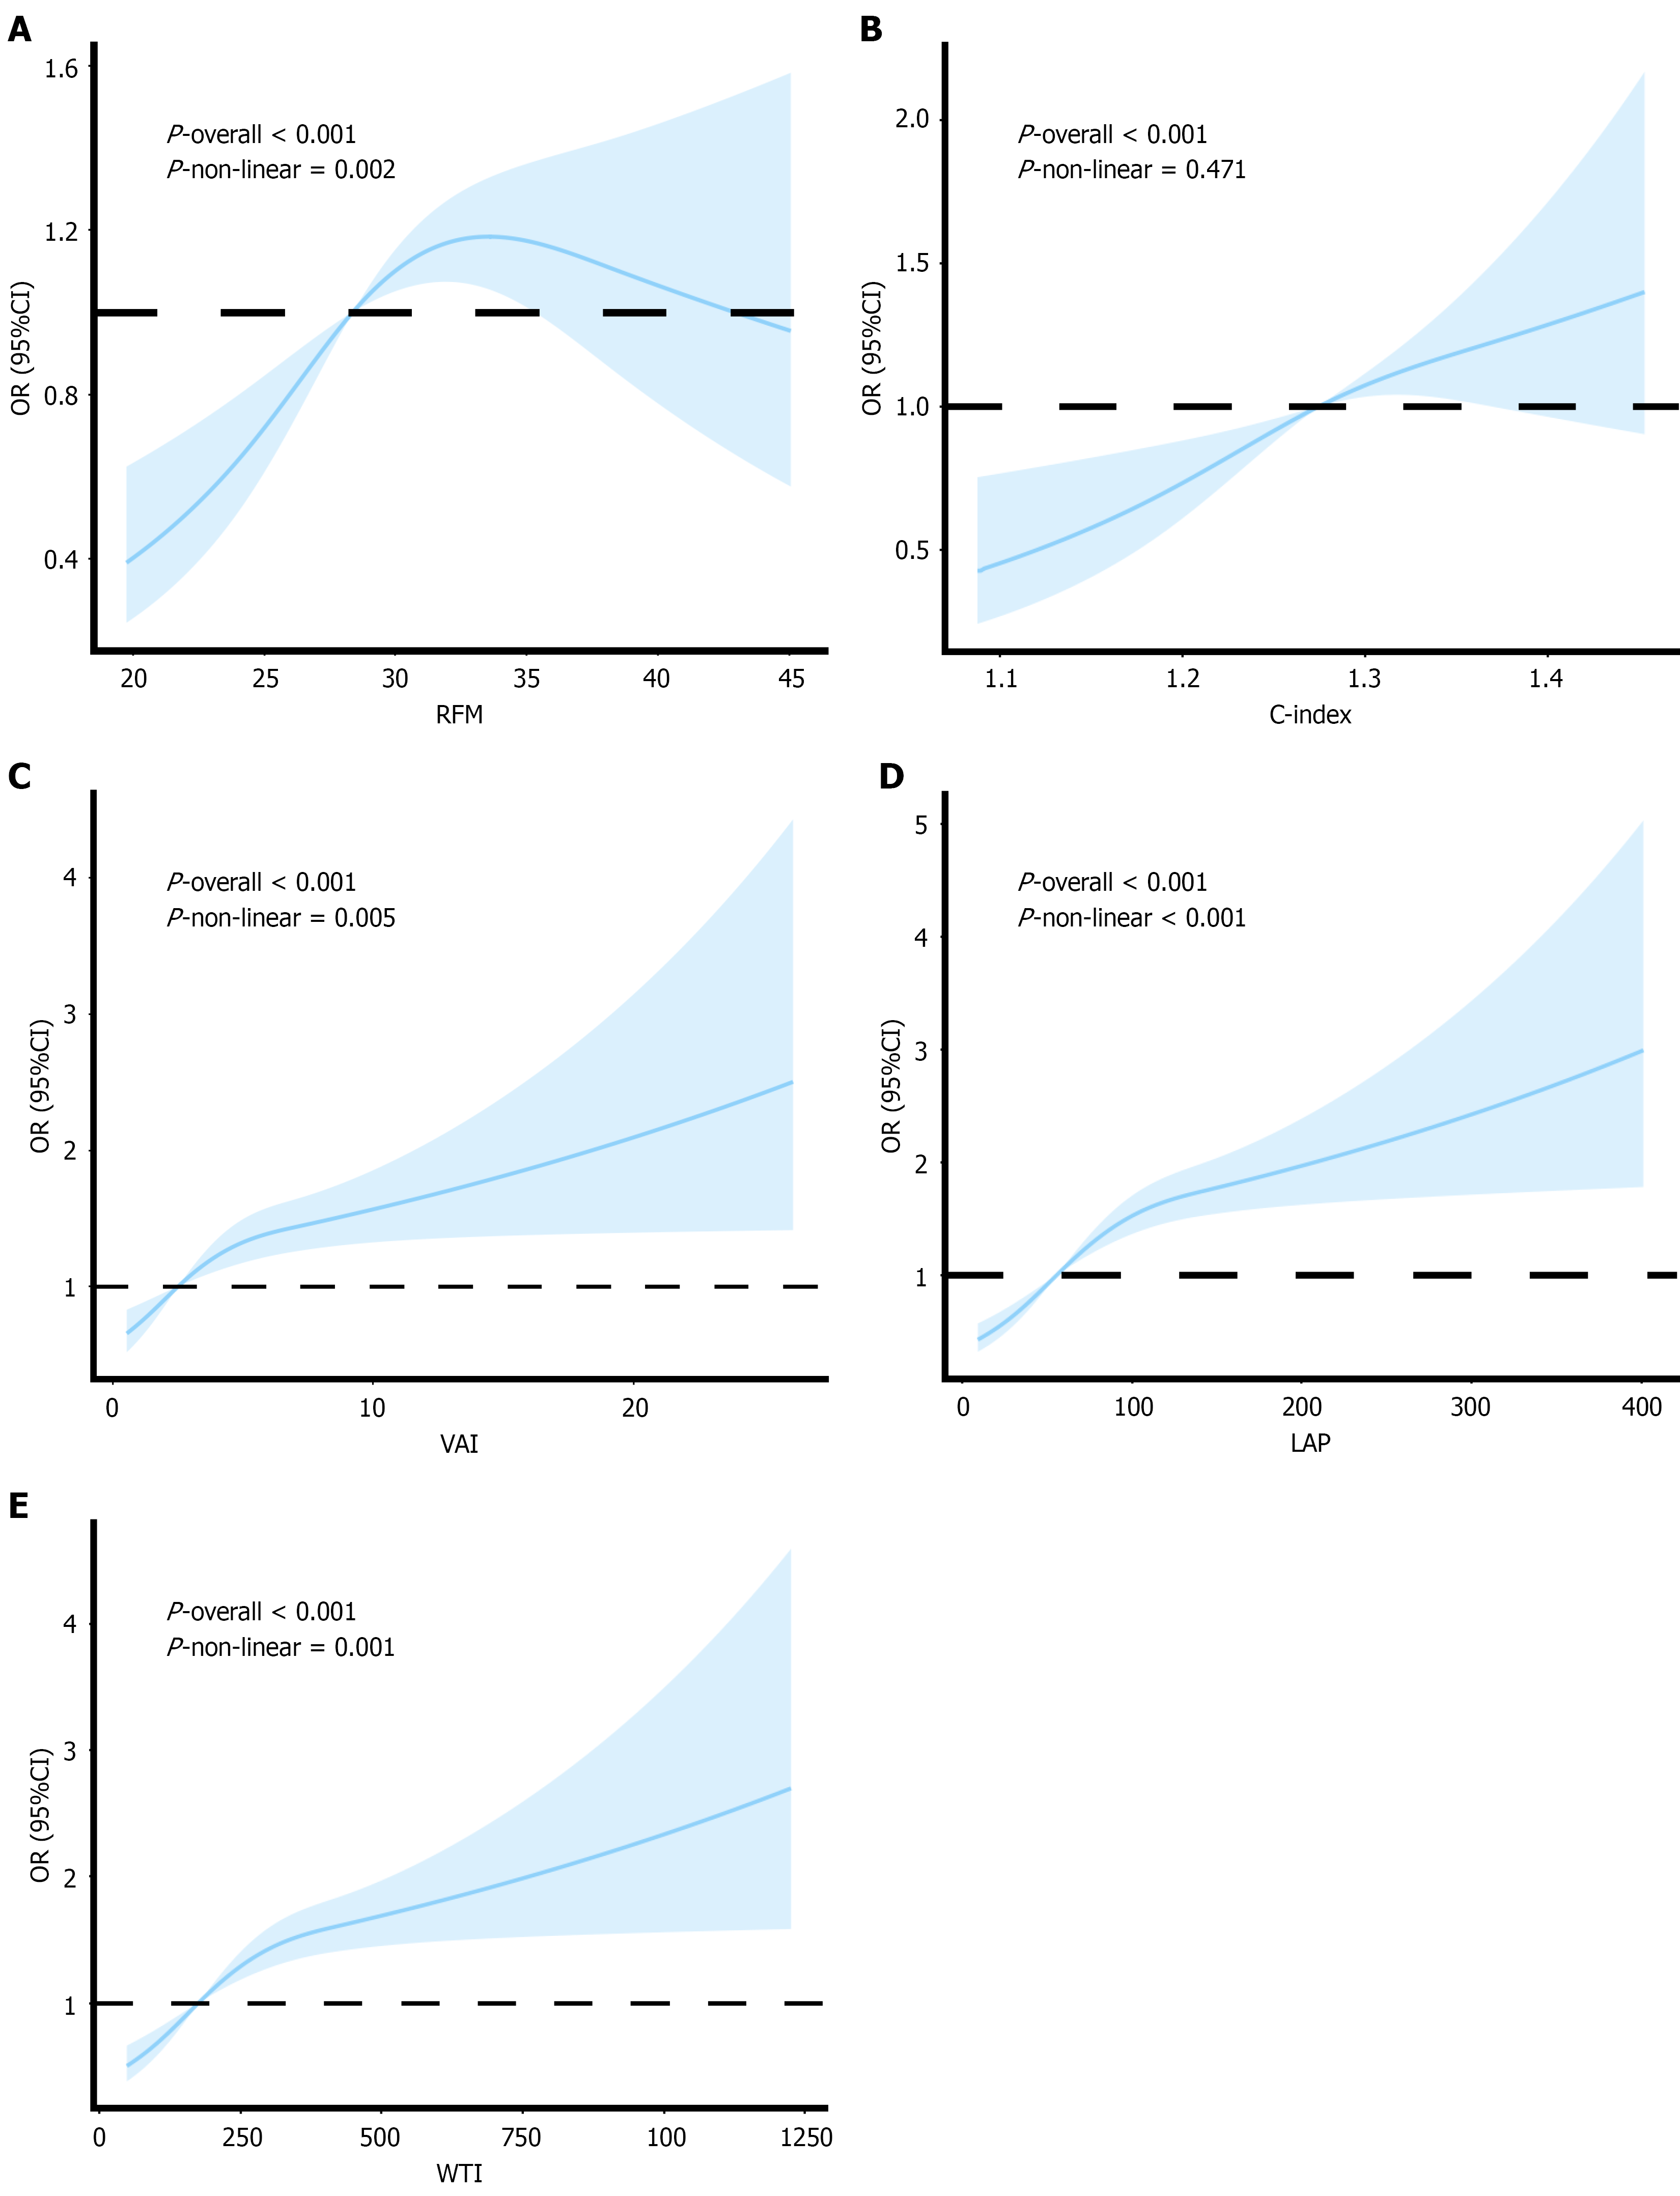
Figure 3 Restricted cubic spline analyses of the associations between obesity-related indices and chronic kidney disease risk.
A: Non-linear association between relative fat mass and chronic kidney disease (CKD) risk; B: Linear association between conicity index and CKD risk; C: Non-linear association between visceral adiposity index and CKD risk; D: Non-linear association between lipid accumulation product and CKD risk; E: Non-linear association between waist-triglyceride index and CKD risk. CI: Confidence interval; OR: Odds ratio; RFM: Relative fat mass; C-index: Conicity index; VAI: Visceral adiposity index; LAP: Lipid accumulation product; WTI: Waist-triglyceride index.
- Citation: Huang DN, Ma J, Pan Q, Xu GG, Guo LX. Association of obesity-related indices with chronic kidney disease risk in diabetes: A cross-sectional study. World J Diabetes 2026; 17(5): 117338
- URL: https://www.wjgnet.com/1948-9358/full/v17/i5/117338.htm
- DOI: https://dx.doi.org/10.4239/wjd.v17.i5.117338