
















Copyright: ©Author(s) 2026.
World J Diabetes. May 15, 2026; 17(5): 117237
Published online May 15, 2026. doi: 10.4239/wjd.v17.i5.117237
Published online May 15, 2026. doi: 10.4239/wjd.v17.i5.117237
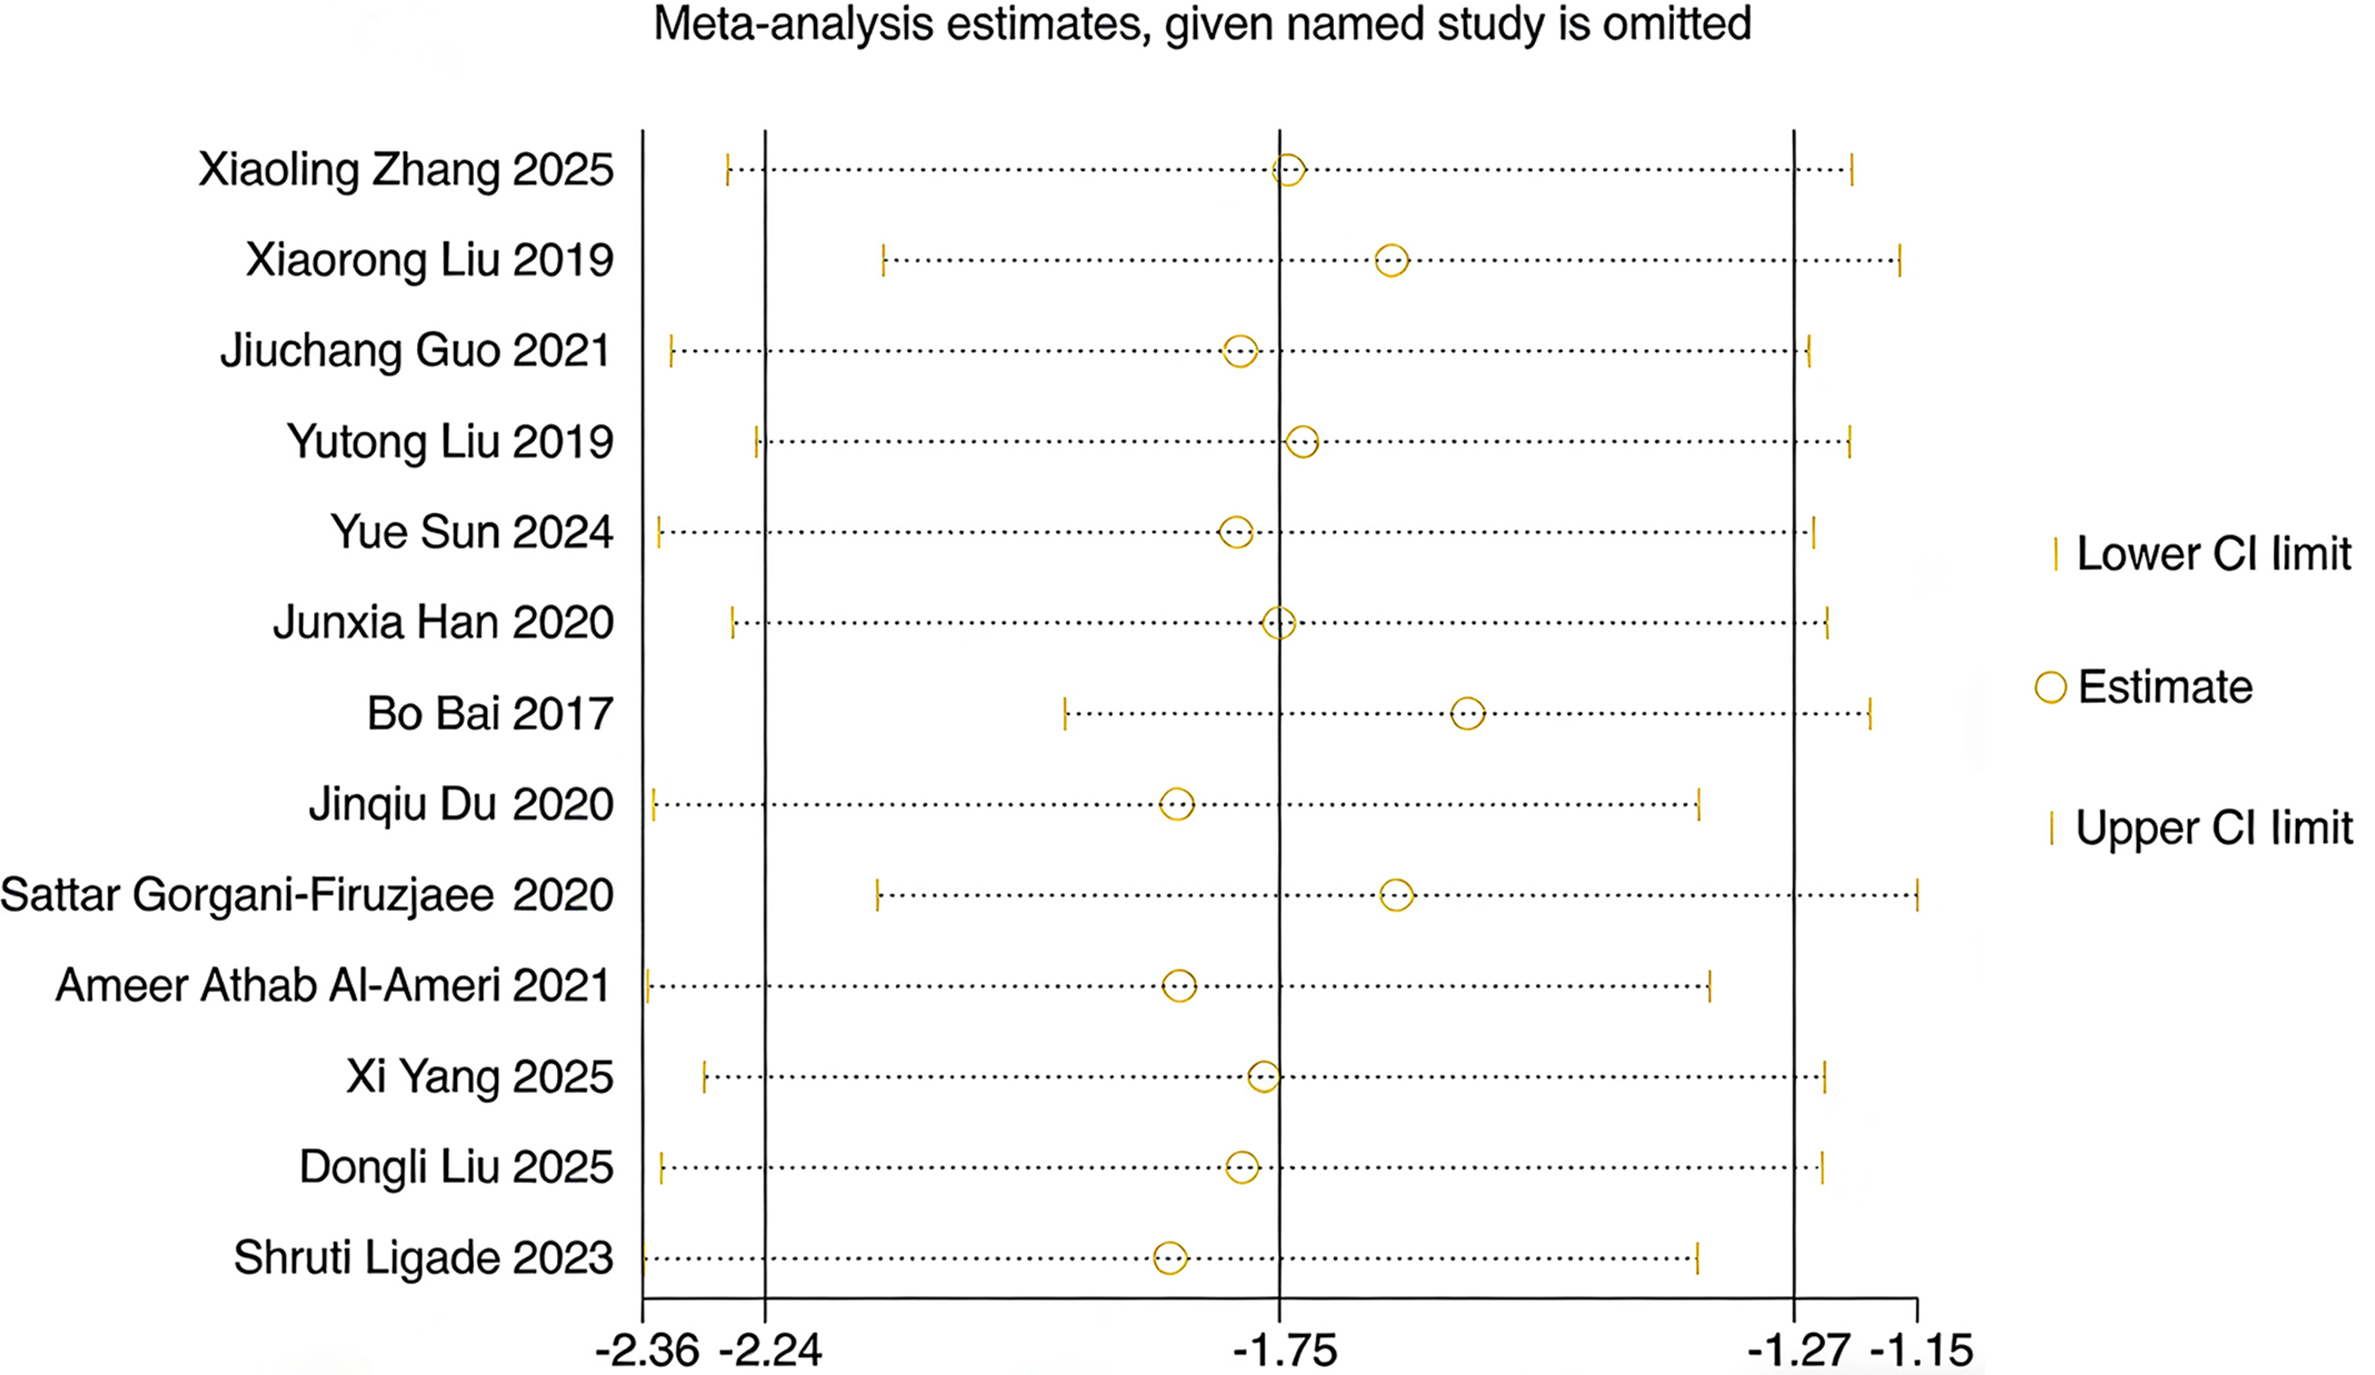
Figure 4 Sensitivity analysis using standardized mean difference.
Each point represents the pooled standardized mean difference after sequential exclusion of one study. Horizontal lines indicate the corresponding 95% confidence intervals. The vertical dashed line represents the overall pooled standardized mean difference including all studies. The minimal change in effect estimates across exclusions suggests that the overall result is robust and not driven by any single study. CI: Confidence interval.
- Citation: Chen L, Gao CB, Duan Q, Shi G, Niu QS. Association between circulating CTRP12 levels and type 2 diabetes: A meta-analysis. World J Diabetes 2026; 17(5): 117237
- URL: https://www.wjgnet.com/1948-9358/full/v17/i5/117237.htm
- DOI: https://dx.doi.org/10.4239/wjd.v17.i5.117237