
















Copyright: ©Author(s) 2026.
World J Diabetes. Apr 15, 2026; 17(4): 116772
Published online Apr 15, 2026. doi: 10.4239/wjd.v17.i4.116772
Published online Apr 15, 2026. doi: 10.4239/wjd.v17.i4.116772
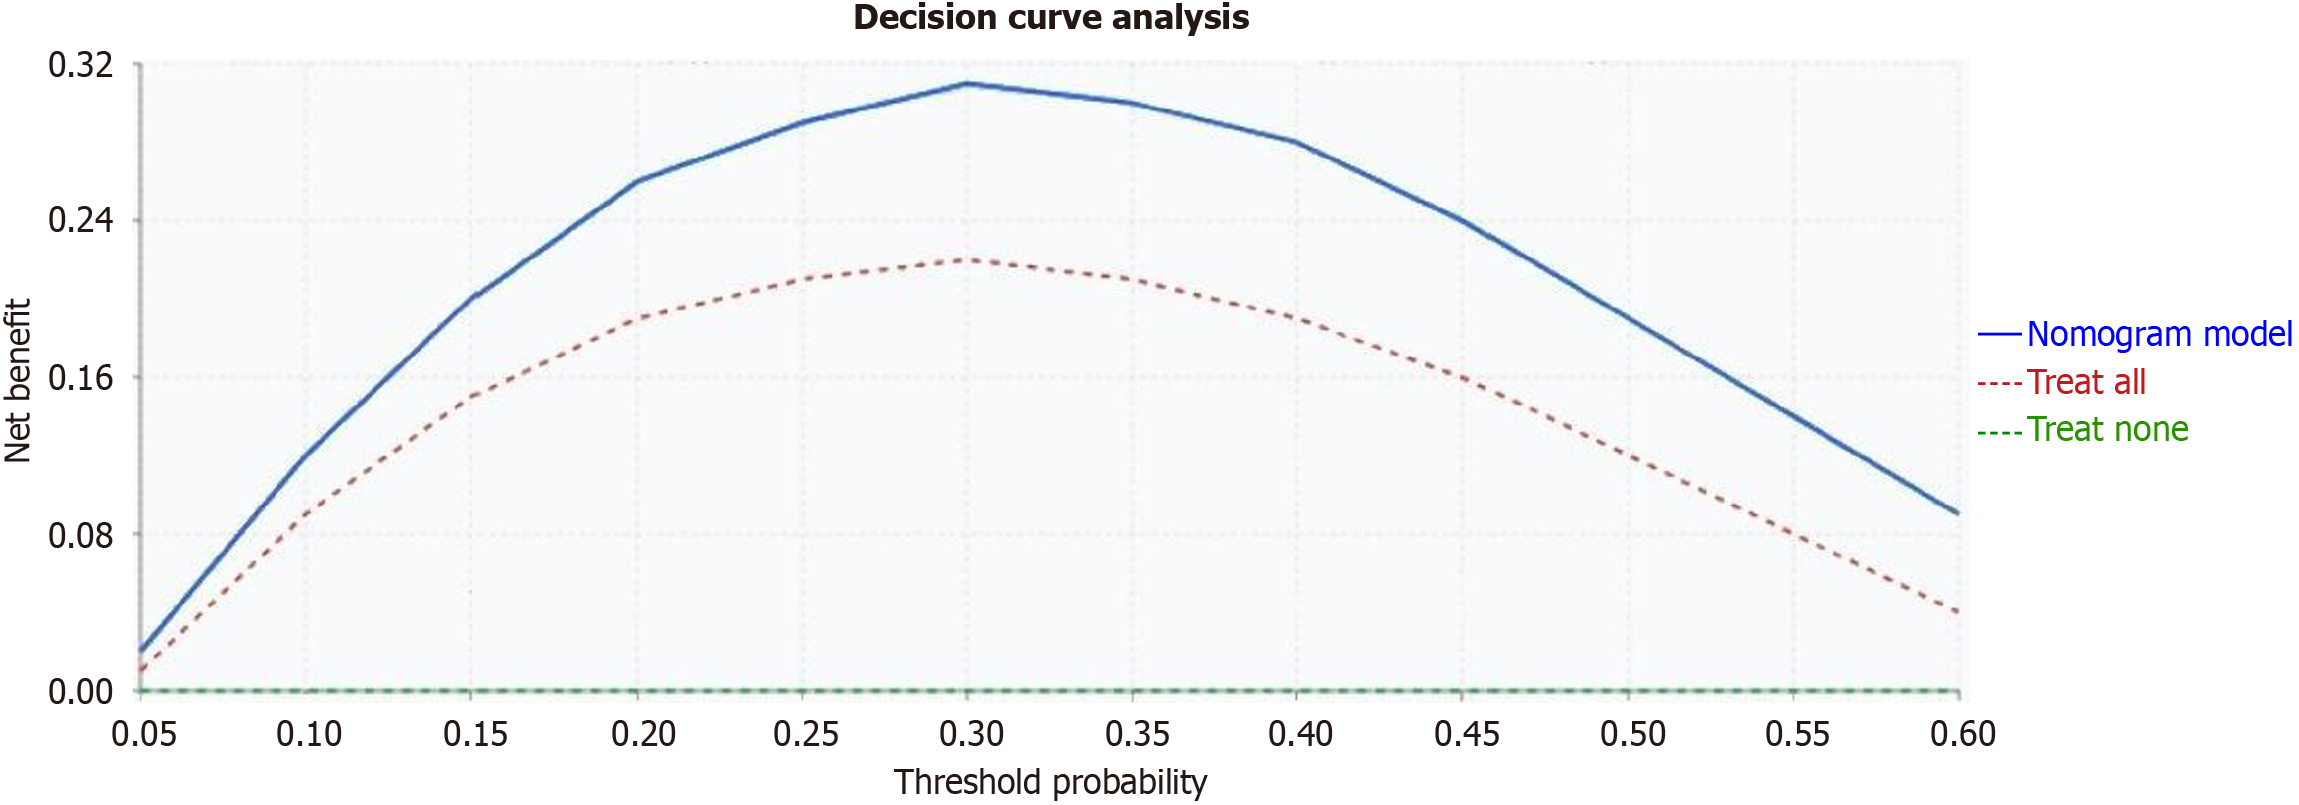
Figure 6 Decision curve analysis for POCD prediction model.
The nomogram model (blue solid line) provides superior net benefit across threshold probabilities of 5%-60%, with maximum clinical utility at 20%-40%, compared to treat-all (red dashed line) and treat-none strategies.
- Citation: Huang P, Qin XQ, Huang Q, Wang SD, Wu YY, Huang XR, Lin X. Prediction model for rapid estimated glomerular filtration rate decline in type 2 diabetes mellitus. World J Diabetes 2026; 17(4): 116772
- URL: https://www.wjgnet.com/1948-9358/full/v17/i4/116772.htm
- DOI: https://dx.doi.org/10.4239/wjd.v17.i4.116772