
















Copyright: ©Author(s) 2026.
World J Diabetes. Apr 15, 2026; 17(4): 116772
Published online Apr 15, 2026. doi: 10.4239/wjd.v17.i4.116772
Published online Apr 15, 2026. doi: 10.4239/wjd.v17.i4.116772
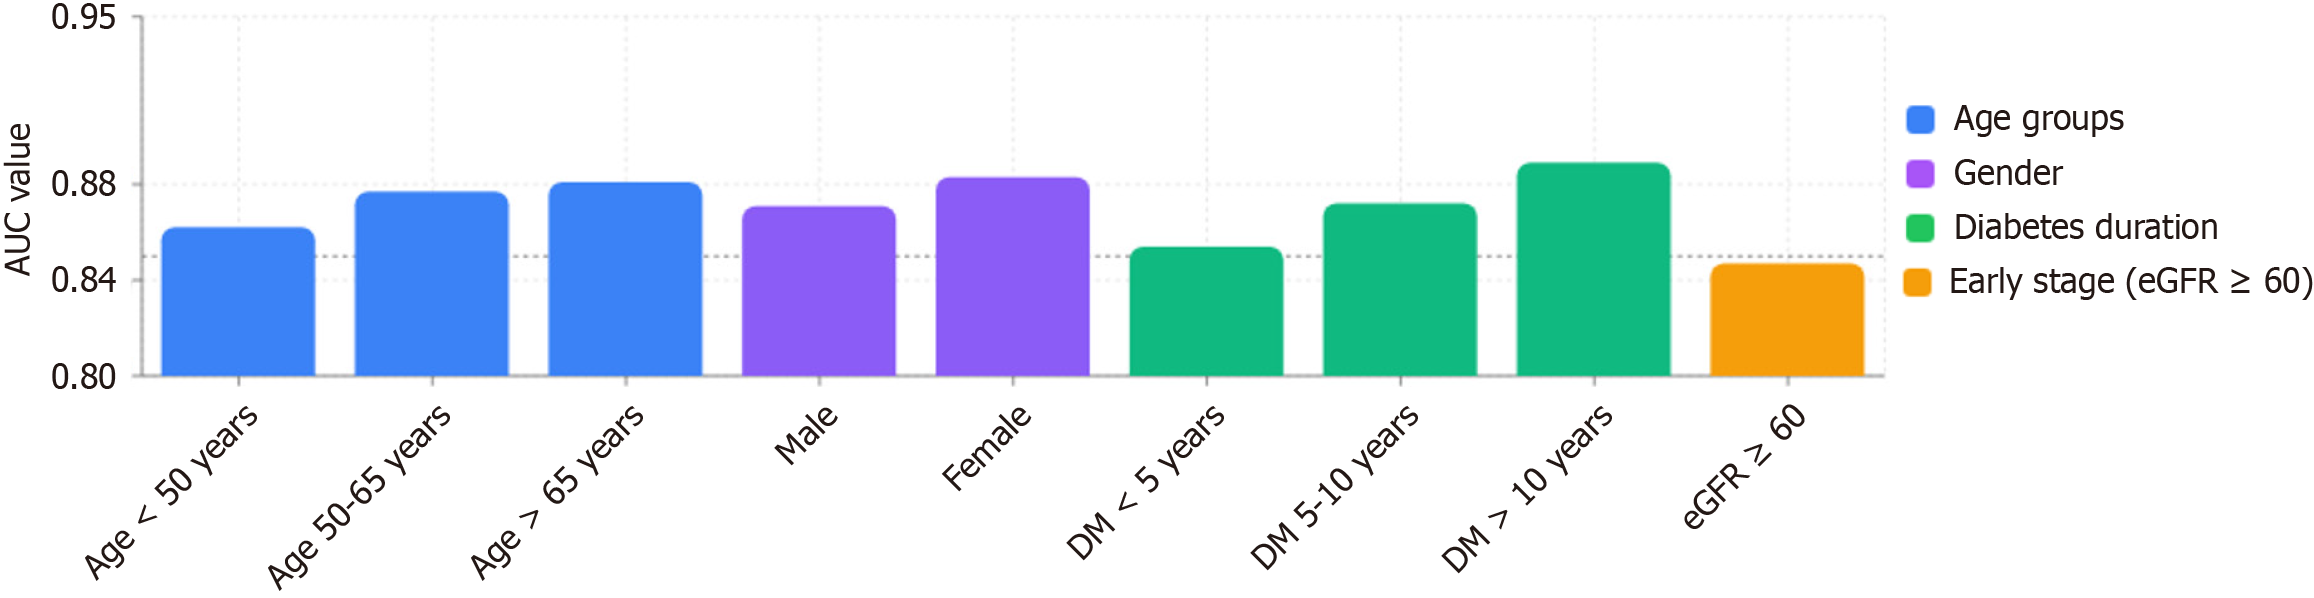
Figure 5 Subgroup analysis of the Nomogram model performance across different patient populations.
The bar chart demonstrates the area under the curve (AUC) values with 95% confidence intervals for nine distinct subgroups. Age groups (blue bars, n = 3) showed AUC values ranging from 0.862-0.881; gender subgroups (purple bars, n = 2) displayed AUC values of 0.871-0.883; diabetes duration categories (green bars, n = 3) exhibited AUC values of 0.854-0.889; and the early-stage subgroup with baseline estimated glomerular filtration rate ≥ 60 mL/minute/1.73 m2 (orange bar) achieved an AUC of 0.847. The horizontal dashed line indicates the reference threshold of 0.85. No significant differences were observed among subgroups (all P > 0.4), confirming stable model performance across diverse patient characteristics. Notably, the model maintained good discriminative ability even in early-stage patients, demonstrating potential for ultra-early intervention strategies. AUC: Area under the curve; eGFR: Estimated glomerular filtration rate; DM: Diabetes mellitus.
- Citation: Huang P, Qin XQ, Huang Q, Wang SD, Wu YY, Huang XR, Lin X. Prediction model for rapid estimated glomerular filtration rate decline in type 2 diabetes mellitus. World J Diabetes 2026; 17(4): 116772
- URL: https://www.wjgnet.com/1948-9358/full/v17/i4/116772.htm
- DOI: https://dx.doi.org/10.4239/wjd.v17.i4.116772