
















Copyright: ©Author(s) 2026.
World J Diabetes. Apr 15, 2026; 17(4): 116772
Published online Apr 15, 2026. doi: 10.4239/wjd.v17.i4.116772
Published online Apr 15, 2026. doi: 10.4239/wjd.v17.i4.116772
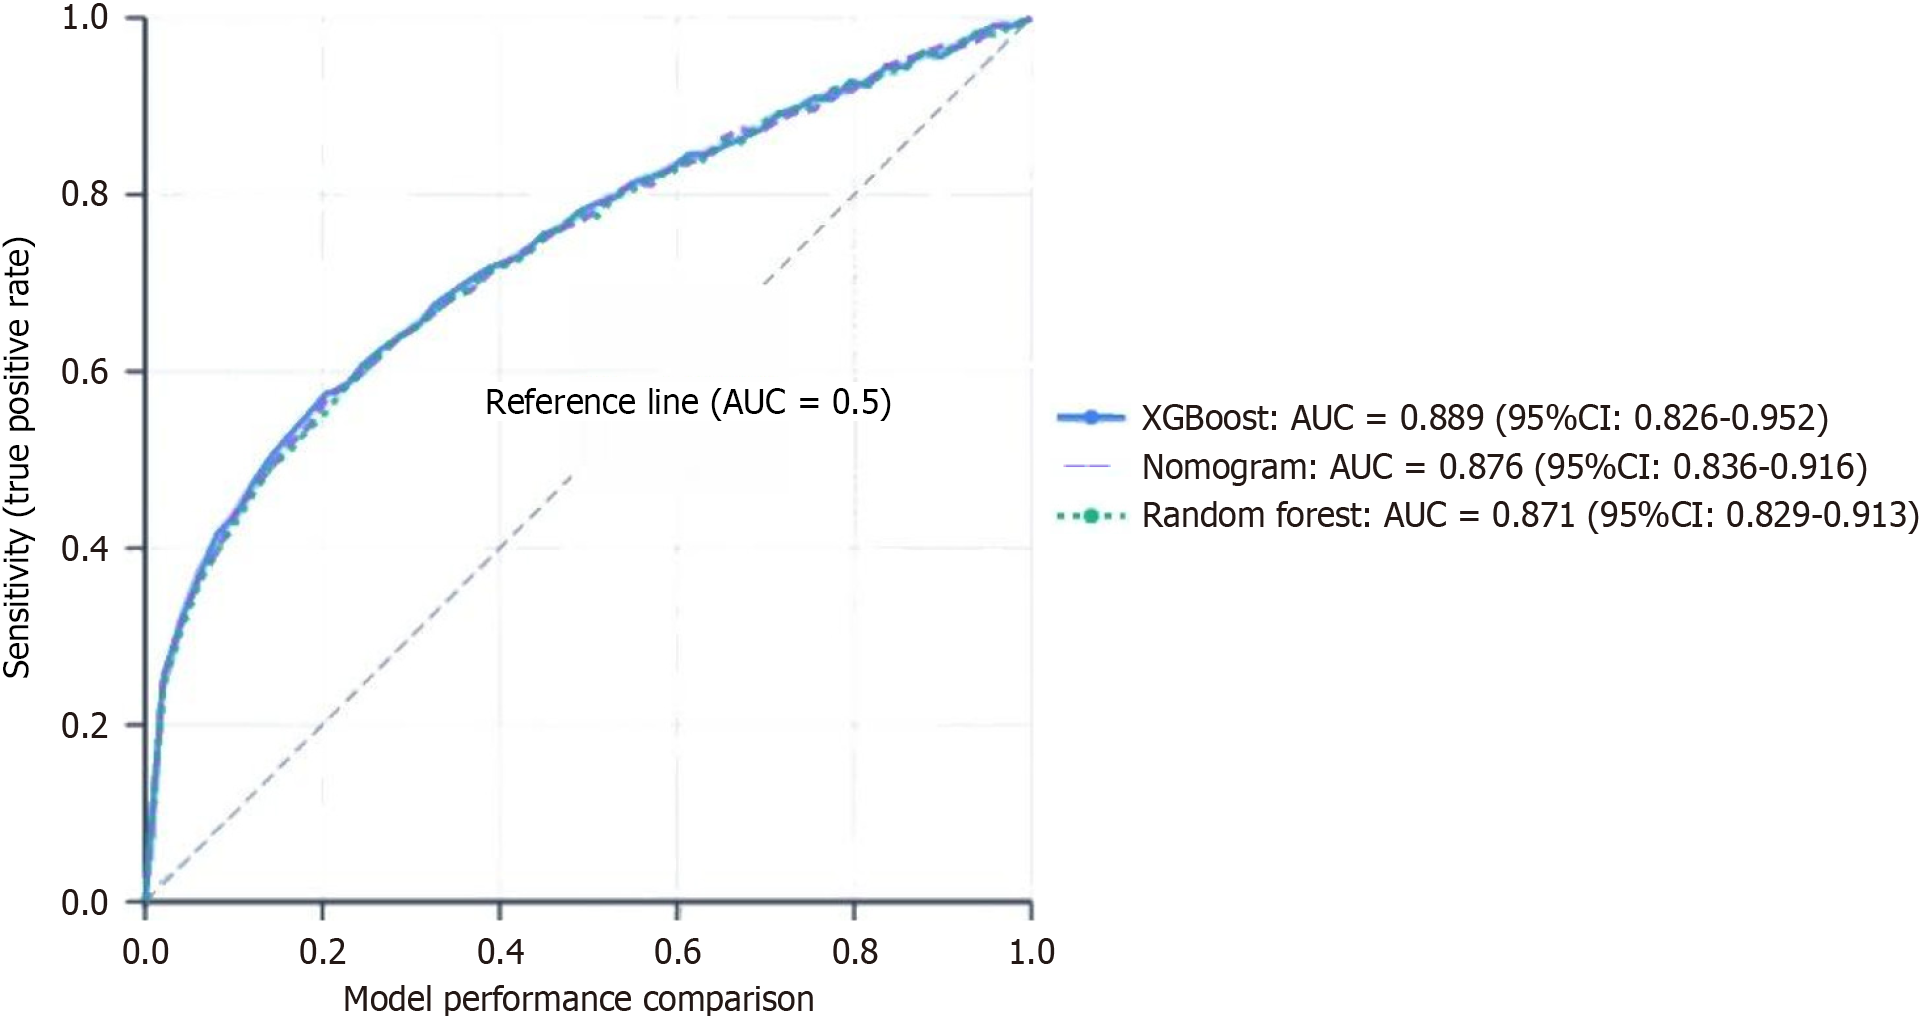
Figure 4 Receiver operating characteristic curve comparison of three prediction models.
Receiver operating characteristic curves comparing eXtreme Gradient Boosting [blue solid line, area under the curve (AUC) = 0.889, 95% confidence interval (CI): 0.826-0.952], Nomogram (purple dashed line, AUC = 0.876, 95%CI: 0.836-0.916), and Random Forest (green dotted line, AUC = 0.871, 95%CI: 0.829-0.913). eXtreme Gradient Boosting demonstrated the highest discrimination ability, though DeLong test showed no significant difference among the three models (P = 0.285). The diagonal reference line represents random classification (AUC = 0.5). XGBoost: EXtreme Gradient Boosting; AUC: Area under the curve.
- Citation: Huang P, Qin XQ, Huang Q, Wang SD, Wu YY, Huang XR, Lin X. Prediction model for rapid estimated glomerular filtration rate decline in type 2 diabetes mellitus. World J Diabetes 2026; 17(4): 116772
- URL: https://www.wjgnet.com/1948-9358/full/v17/i4/116772.htm
- DOI: https://dx.doi.org/10.4239/wjd.v17.i4.116772