
















Copyright: ©Author(s) 2026.
World J Diabetes. Apr 15, 2026; 17(4): 116772
Published online Apr 15, 2026. doi: 10.4239/wjd.v17.i4.116772
Published online Apr 15, 2026. doi: 10.4239/wjd.v17.i4.116772
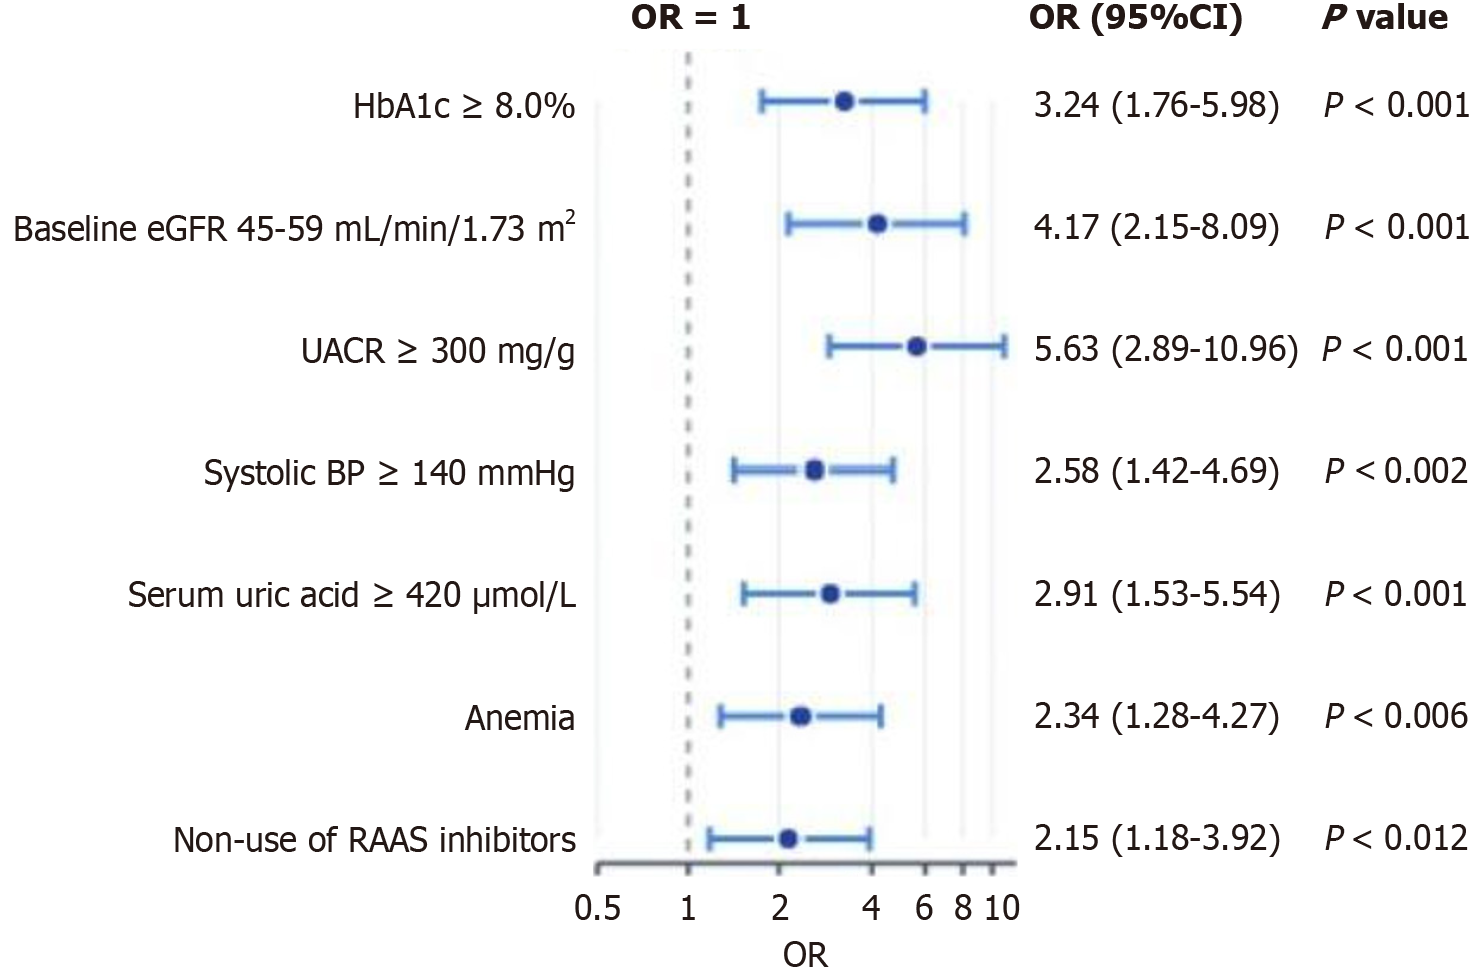
Figure 2 Forest plot of independent risk factors for diabetic kidney disease progression.
All factors demonstrated statistical significance (P < 0.05). Multivariate logistic regression analysis identified seven independent risk factors. Urinary albumin-to-creatinine ratio ≥ 300 mg/g showed the strongest association [odds ratio (OR) = 5.63, 95% confidence interval (CI): 2.89-10.96], followed by baseline estimated glomerular filtration rate 45-59 mL/minute/1.73 m2 (OR = 4.17, 95%CI: 2.15-8.09) and hemoglobin A1c ≥ 8.0% (OR = 3.24, 95%CI: 1.76-5.98). Other significant factors included serum uric acid ≥ 420 μmol/L (OR = 2.91), systolic blood pressure ≥ 140 mmHg (OR = 2.58), anemia (OR = 2.34), and non-use of renin-angiotensin-aldosterone system inhibitors (OR = 2.15). The vertical dashed line represents OR = 1.0. OR: Odds ratio; CI: Confidence interval; eGFR: Estimated glomerular filtration rate; UACR: Urinary albumin-to-creatinine ratio; RAAS: Renin-angiotensin-aldosterone system.
- Citation: Huang P, Qin XQ, Huang Q, Wang SD, Wu YY, Huang XR, Lin X. Prediction model for rapid estimated glomerular filtration rate decline in type 2 diabetes mellitus. World J Diabetes 2026; 17(4): 116772
- URL: https://www.wjgnet.com/1948-9358/full/v17/i4/116772.htm
- DOI: https://dx.doi.org/10.4239/wjd.v17.i4.116772