
















Copyright: ©Author(s) 2026.
World J Diabetes. Apr 15, 2026; 17(4): 115437
Published online Apr 15, 2026. doi: 10.4239/wjd.v17.i4.115437
Published online Apr 15, 2026. doi: 10.4239/wjd.v17.i4.115437
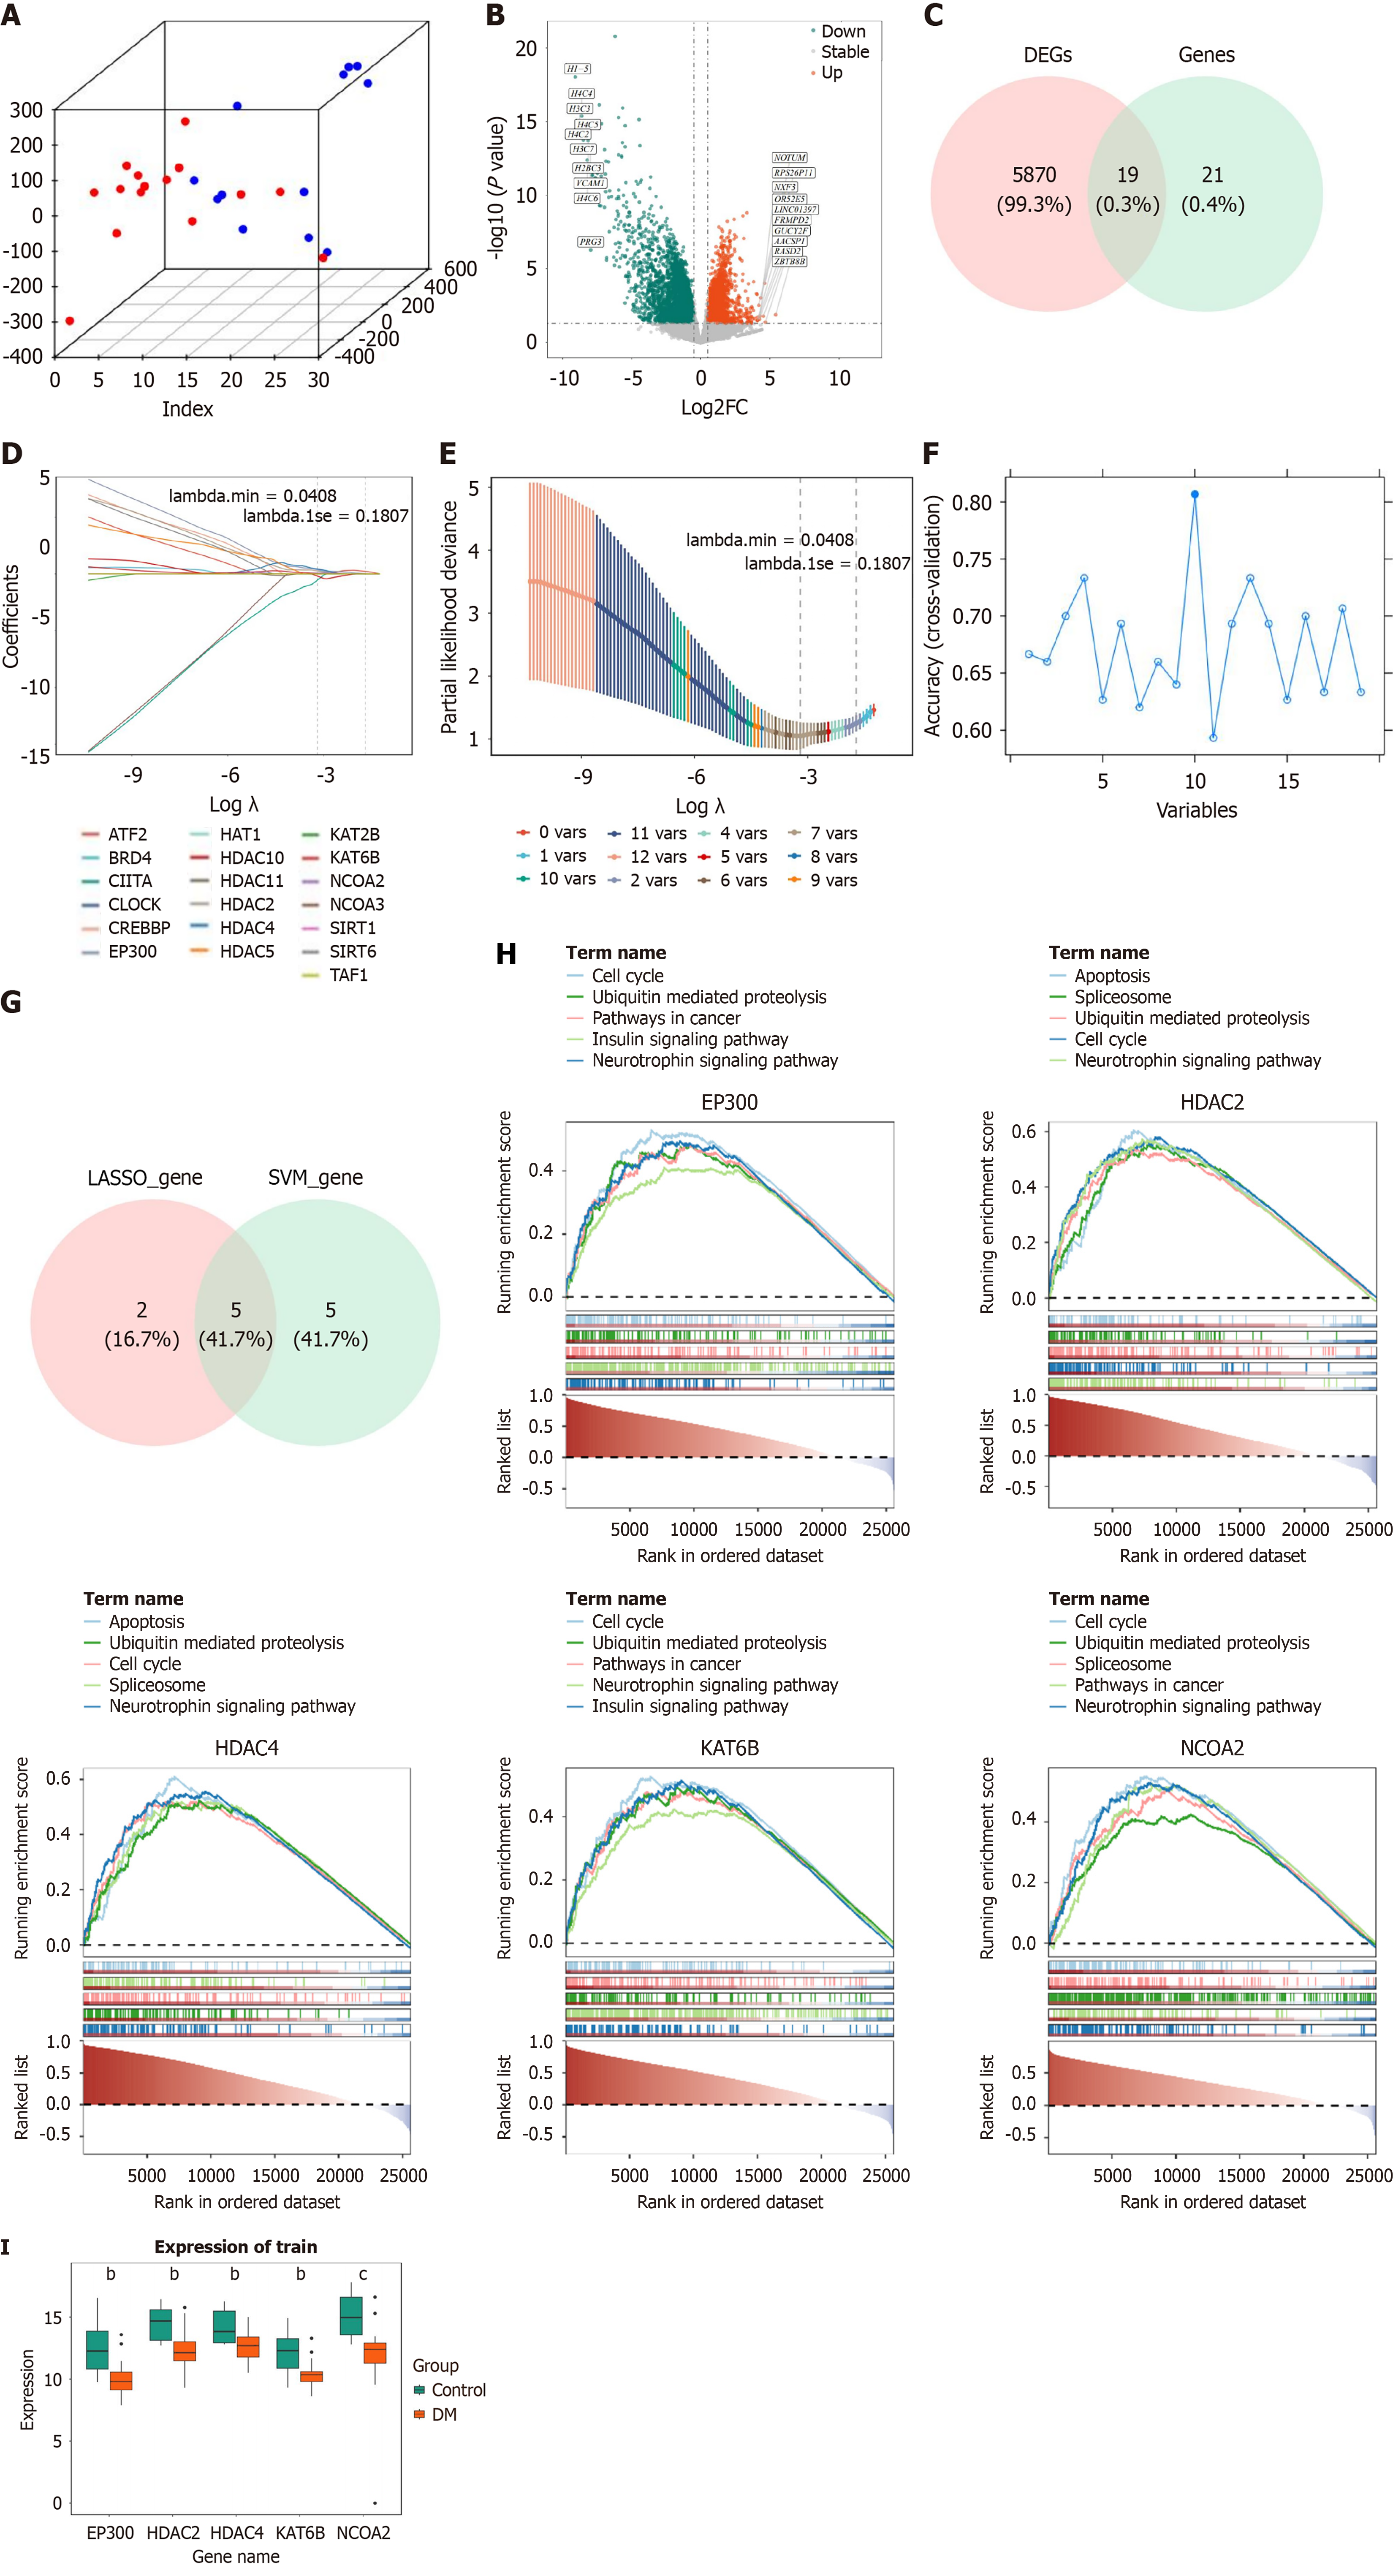
Figure 1 Transcriptome screening of candidate genes.
A: Three-dimensional principal component analysis ; B: Variance analysis volcano map; C: Venny plots of candidate genes; D: Penalty plot of least absolute shrinkage and selection operator logistic regression coefficients; E: Least absolute shrinkage and selection operator cross validation diagram; F: Potential biomarkers screened by machine learning-support vector machine-recursive feature elimination algorithm; G: Machine learning intersection genes; H: GSEA enrichment results for key genes; I: Box plot of key gene expression. bP < 0.01, cP < 0.001. DEGs: Differentially expressed genes; DN: Diabetic nephropathy.
- Citation: Si W, Dai Y, Hu GP, Zhang Q, Lv F, Zhang Q. EP300 drives renal fibrosis in diabetic nephropathy via histone acetyltransferase-mediated nephrocystin-4 expression. World J Diabetes 2026; 17(4): 115437
- URL: https://www.wjgnet.com/1948-9358/full/v17/i4/115437.htm
- DOI: https://dx.doi.org/10.4239/wjd.v17.i4.115437