
















Copyright: ©Author(s) 2026.
World J Diabetes. Apr 15, 2026; 17(4): 114061
Published online Apr 15, 2026. doi: 10.4239/wjd.v17.i4.114061
Published online Apr 15, 2026. doi: 10.4239/wjd.v17.i4.114061
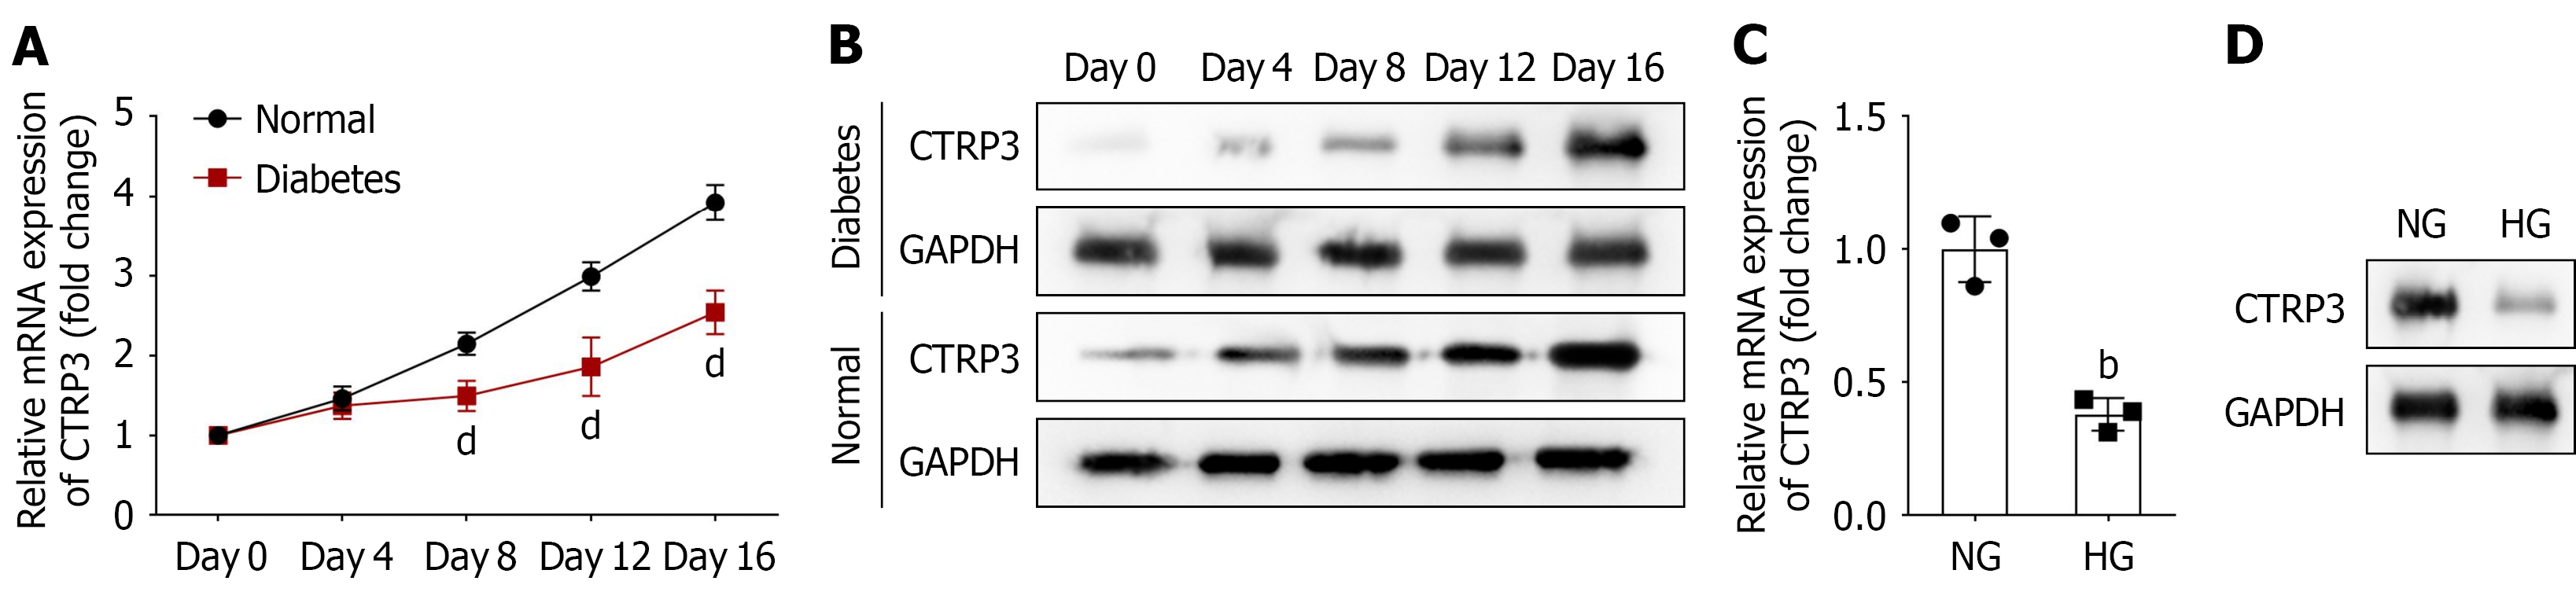
Figure 1 C1q tumor necrosis factor associated protein 3 expression is low in the high-glucose-treated HaCaT cells.
A: Quantitative polymerase chain reaction (qPCR) analysis of messenger RNA (mRNA) levels of C1q tumor necrosis factor associated protein 3 (CTRP3) in blood samples collected from normal and diabetic mice at days 0, 4, 8, 12, and 16; B: Western blot analysis of protein levels of CTRP3 in blood samples collected from normal and diabetic mice at days 0, 4, 8, 12, and 16; C: QPCR analysis of mRNA levels of CTRP3 in HaCaT cells treated with 5.6 mmol/L glucose or 30 mmol/L glucose 48 hours later; D: Western blot analysis of protein levels of CTRP3 in HaCaT cells treated with 5.6 mmol/L glucose or 30 mmol/L glucose 48 hours later. bP < 0.01 vs 5.6 mmol/L glucose group. dP < 0.0001 vs normal group. mRNA: Messenger RNA; CTRP3: C1q tumor necrosis factor associated protein 3; NG: 5.6 mmol/L glucose group; HG: 30 mmol/L glucose group; GAPDH: Glyceraldehyde-3-phosphate dehydrogenase.
- Citation: He L, Zhu C, Yu XY, Dou HC, Shu MG. C1q tumor necrosis factor associated protein 3 protects HaCaT via phosphoinositide 3-kinase/protein kinase B activation by PTEN reduction. World J Diabetes 2026; 17(4): 114061
- URL: https://www.wjgnet.com/1948-9358/full/v17/i4/114061.htm
- DOI: https://dx.doi.org/10.4239/wjd.v17.i4.114061