
















Copyright: ©Author(s) 2026.
World J Diabetes. Mar 15, 2026; 17(3): 115465
Published online Mar 15, 2026. doi: 10.4239/wjd.v17.i3.115465
Published online Mar 15, 2026. doi: 10.4239/wjd.v17.i3.115465
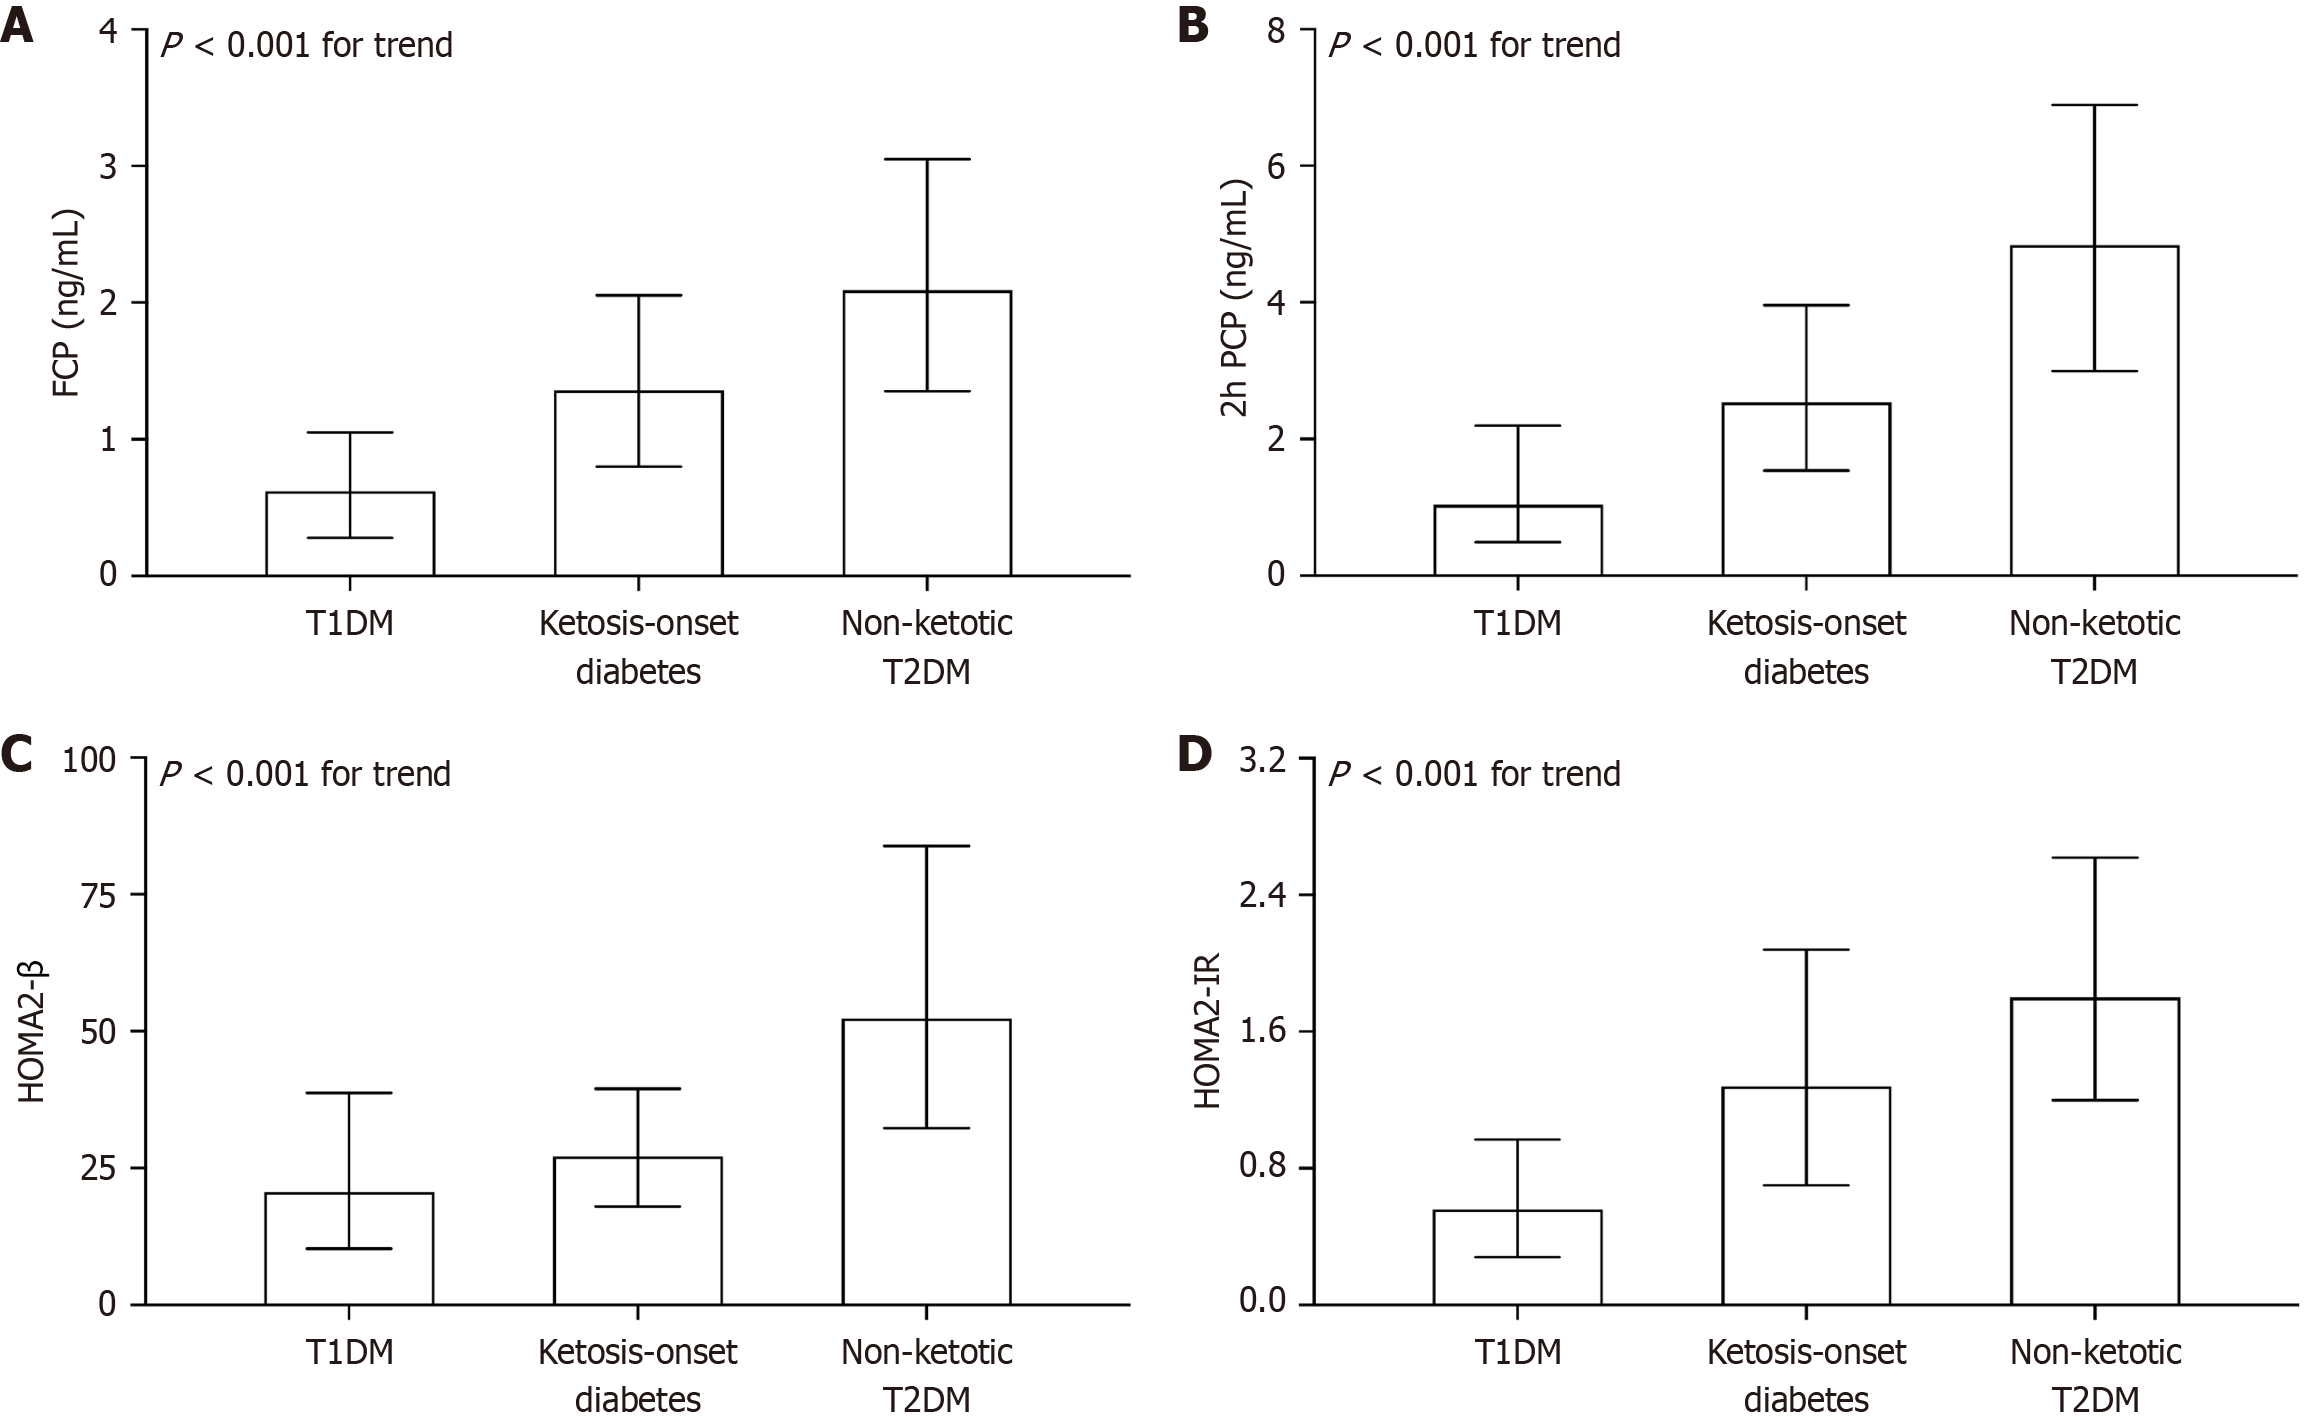
Figure 3 Comparison of islet function-related parameters.
A: Comparison of serum fasting C-peptide levels among patients with type 1 diabetes mellitus (T1DM), ketosis-onset diabetes and non-ketotic T2DM after adjusting for gender and age (P < 0.001 for trend); B: Comparison of serum 2-hour postprandial C-peptide levels among patients with T1DM, ketosis-onset diabetes and non-ketotic T2DM after adjusting for gender and age (P < 0.001 for trend); C: Comparison of homeostasis model assessment index of β-cell function levels among patients with T1DM, ketosis-onset diabetes and non-ketotic T2DM after adjusting for gender and age (P < 0.001 for trend); D: Comparison of homeostasis model assessment index of insulin resistance levels among patients with T1DM, ketosis-onset diabetes and non-ketotic T2DM after adjusting for gender and age (P < 0.001 for trend). FCP: Fasting C-peptide; 2h PCP: 2-hour postprandial C-peptide; T1DM: Type 1 diabetes mellitus; T2DM: Type 2 diabetes mellitus; HOMA2-β: Homeostasis model assessment index of β-cell function; HOMA2-IR: Homeostasis model assessment index of insulin resistance.
- Citation: Xu MR, Li MH, Wang JW, Zhang YW, Lu JX, Ke JF, Li LX. Prevalence and clinical characteristics of diabetic retinopathy in patients newly diagnosed with ketosis-onset diabetes: A real-world study. World J Diabetes 2026; 17(3): 115465
- URL: https://www.wjgnet.com/1948-9358/full/v17/i3/115465.htm
- DOI: https://dx.doi.org/10.4239/wjd.v17.i3.115465