
















Copyright: ©Author(s) 2026.
World J Diabetes. Mar 15, 2026; 17(3): 115433
Published online Mar 15, 2026. doi: 10.4239/wjd.v17.i3.115433
Published online Mar 15, 2026. doi: 10.4239/wjd.v17.i3.115433
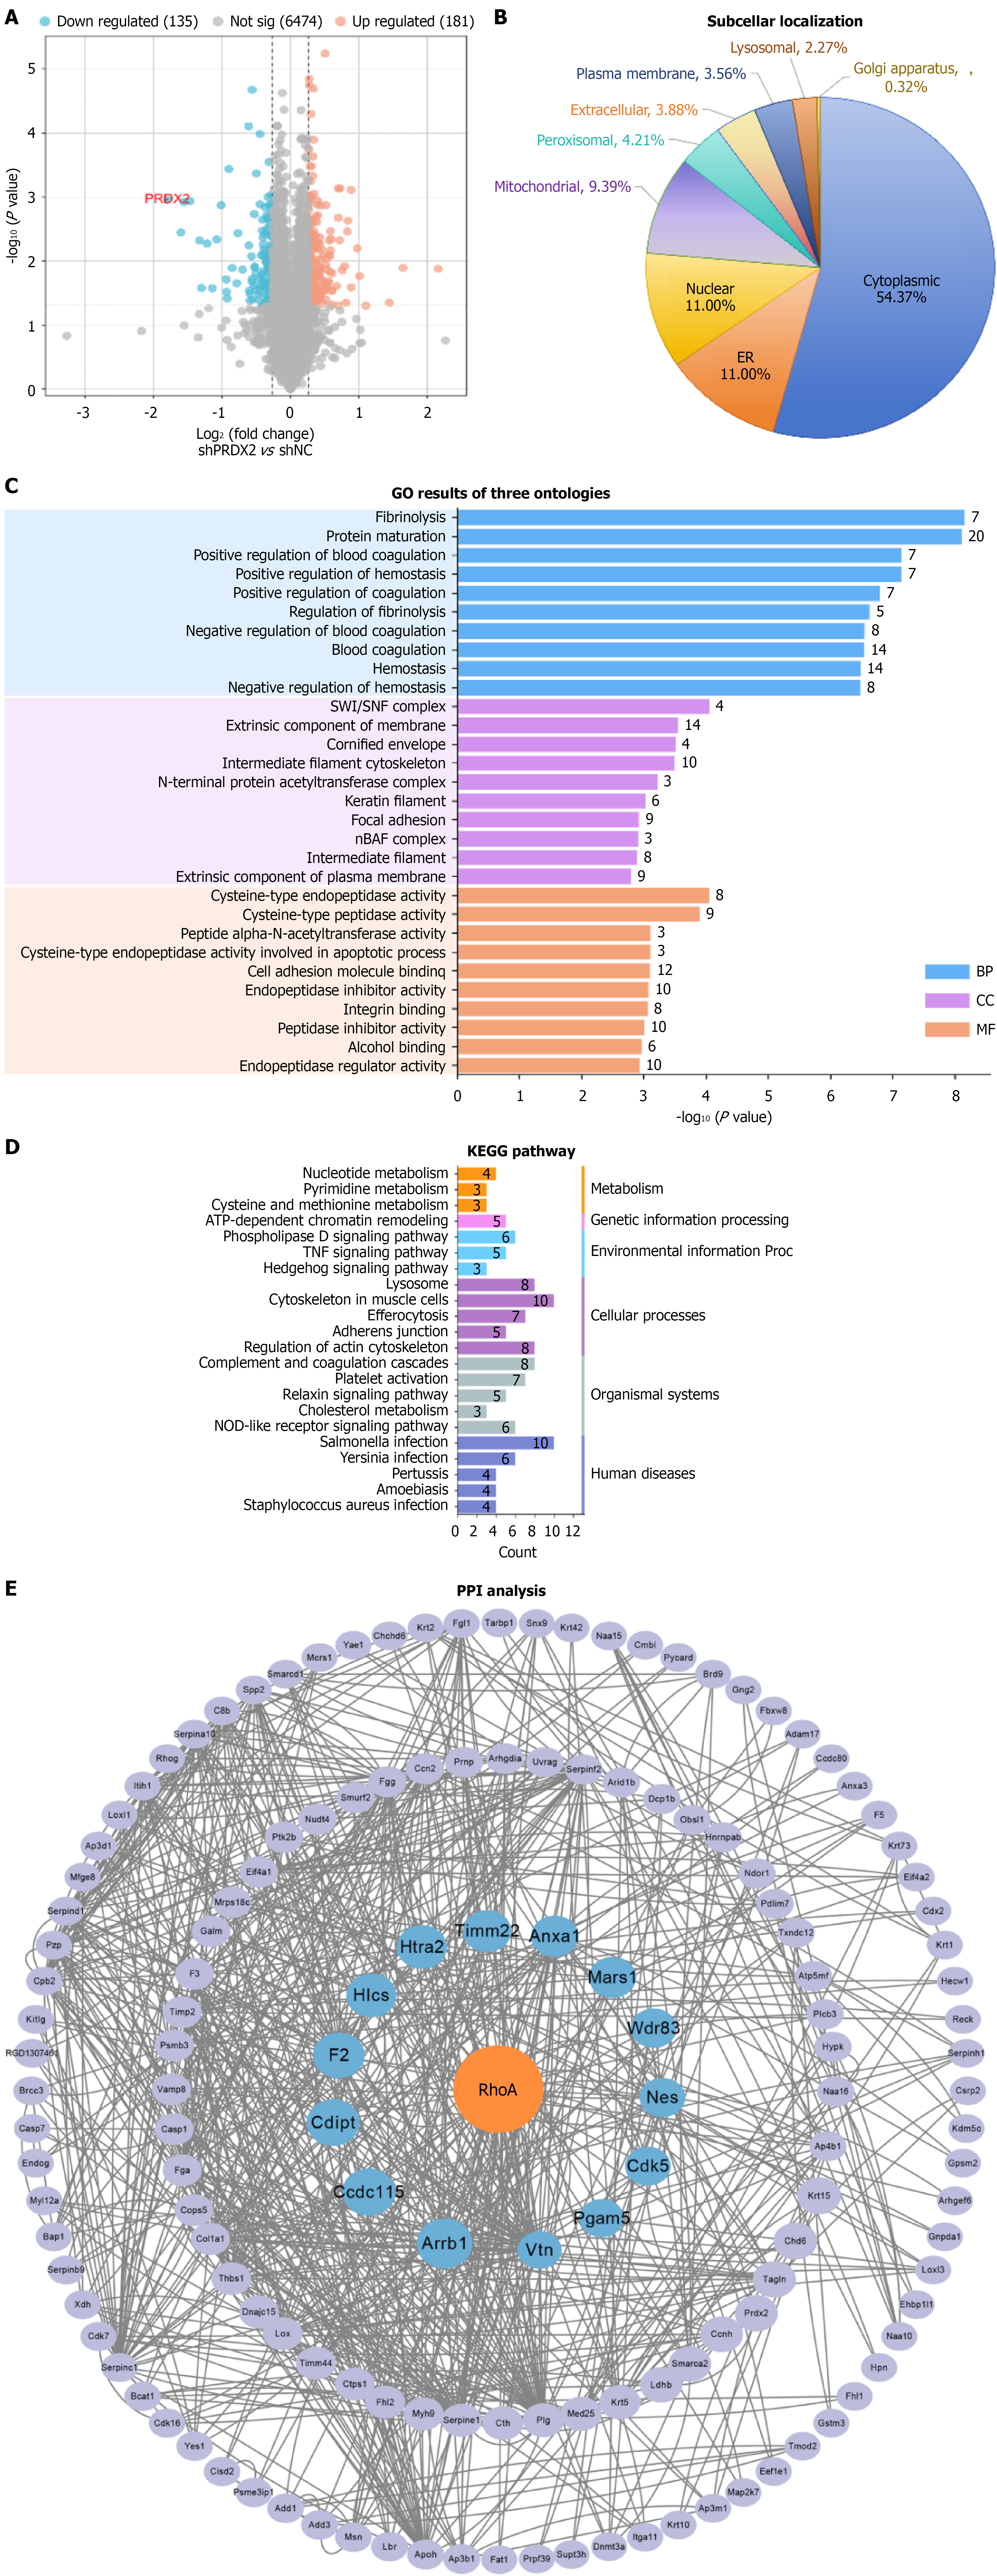
Figure 5 Proteome profiling of PPDX2-silenced Müller cells.
Tandem mass tag quantitative proteomics analysis of rMC-1 cells transfected with PRDX2 shRNA (n = 3) vs shNC (n = 3). A: Volcano plot of 316 significantly differentially expressed proteins [DEPs; fold change > 1.2 and P < 0.05; X axis: Log2 (fold change), Y axis: -log10 (P value); gray: Nonsignificant; orange: Upregulated; blue: Downregulated]; B: Subcellular localization of 316 DEPs; C: Gene Ontology (GO) annotation of the DEPs. The total DEPs were evaluated using biological processes, cellular components, and molecular function terms (X axis: P value; Y axis: GO categories); D: Kyoto Encyclopedia of Genes and Genomes pathway enrichment analysis of the DEPs (X axis: Number of proteins; Y axis: Pathway categories); E: Protein-protein interaction (PPI) network of DEPs. Hub proteins were selected using the Cytoscape tool. Proteins are labeled with gene names, and the circular size indicates their ranking in the PPI analysis. RhoA protein was the hub node for all nodes. KEGG: Kyoto Encyclopedia of Genes and Genomes; GO: Gene Ontology; PPI: Protein-protein interaction; BP: Biological process; CC: Cellular components; MF: Molecular function.
- Citation: Du XL, Ouyang S, Wang YS, Mao YS, Ren BC, Yu WH. PRDX2 silencing alleviates reactive hyperplasia of Müller glial cells in diabetic retinopathy by inhibiting the RhoA/ROCK signaling pathway. World J Diabetes 2026; 17(3): 115433
- URL: https://www.wjgnet.com/1948-9358/full/v17/i3/115433.htm
- DOI: https://dx.doi.org/10.4239/wjd.v17.i3.115433