
















Copyright: ©Author(s) 2026.
World J Diabetes. Mar 15, 2026; 17(3): 115433
Published online Mar 15, 2026. doi: 10.4239/wjd.v17.i3.115433
Published online Mar 15, 2026. doi: 10.4239/wjd.v17.i3.115433
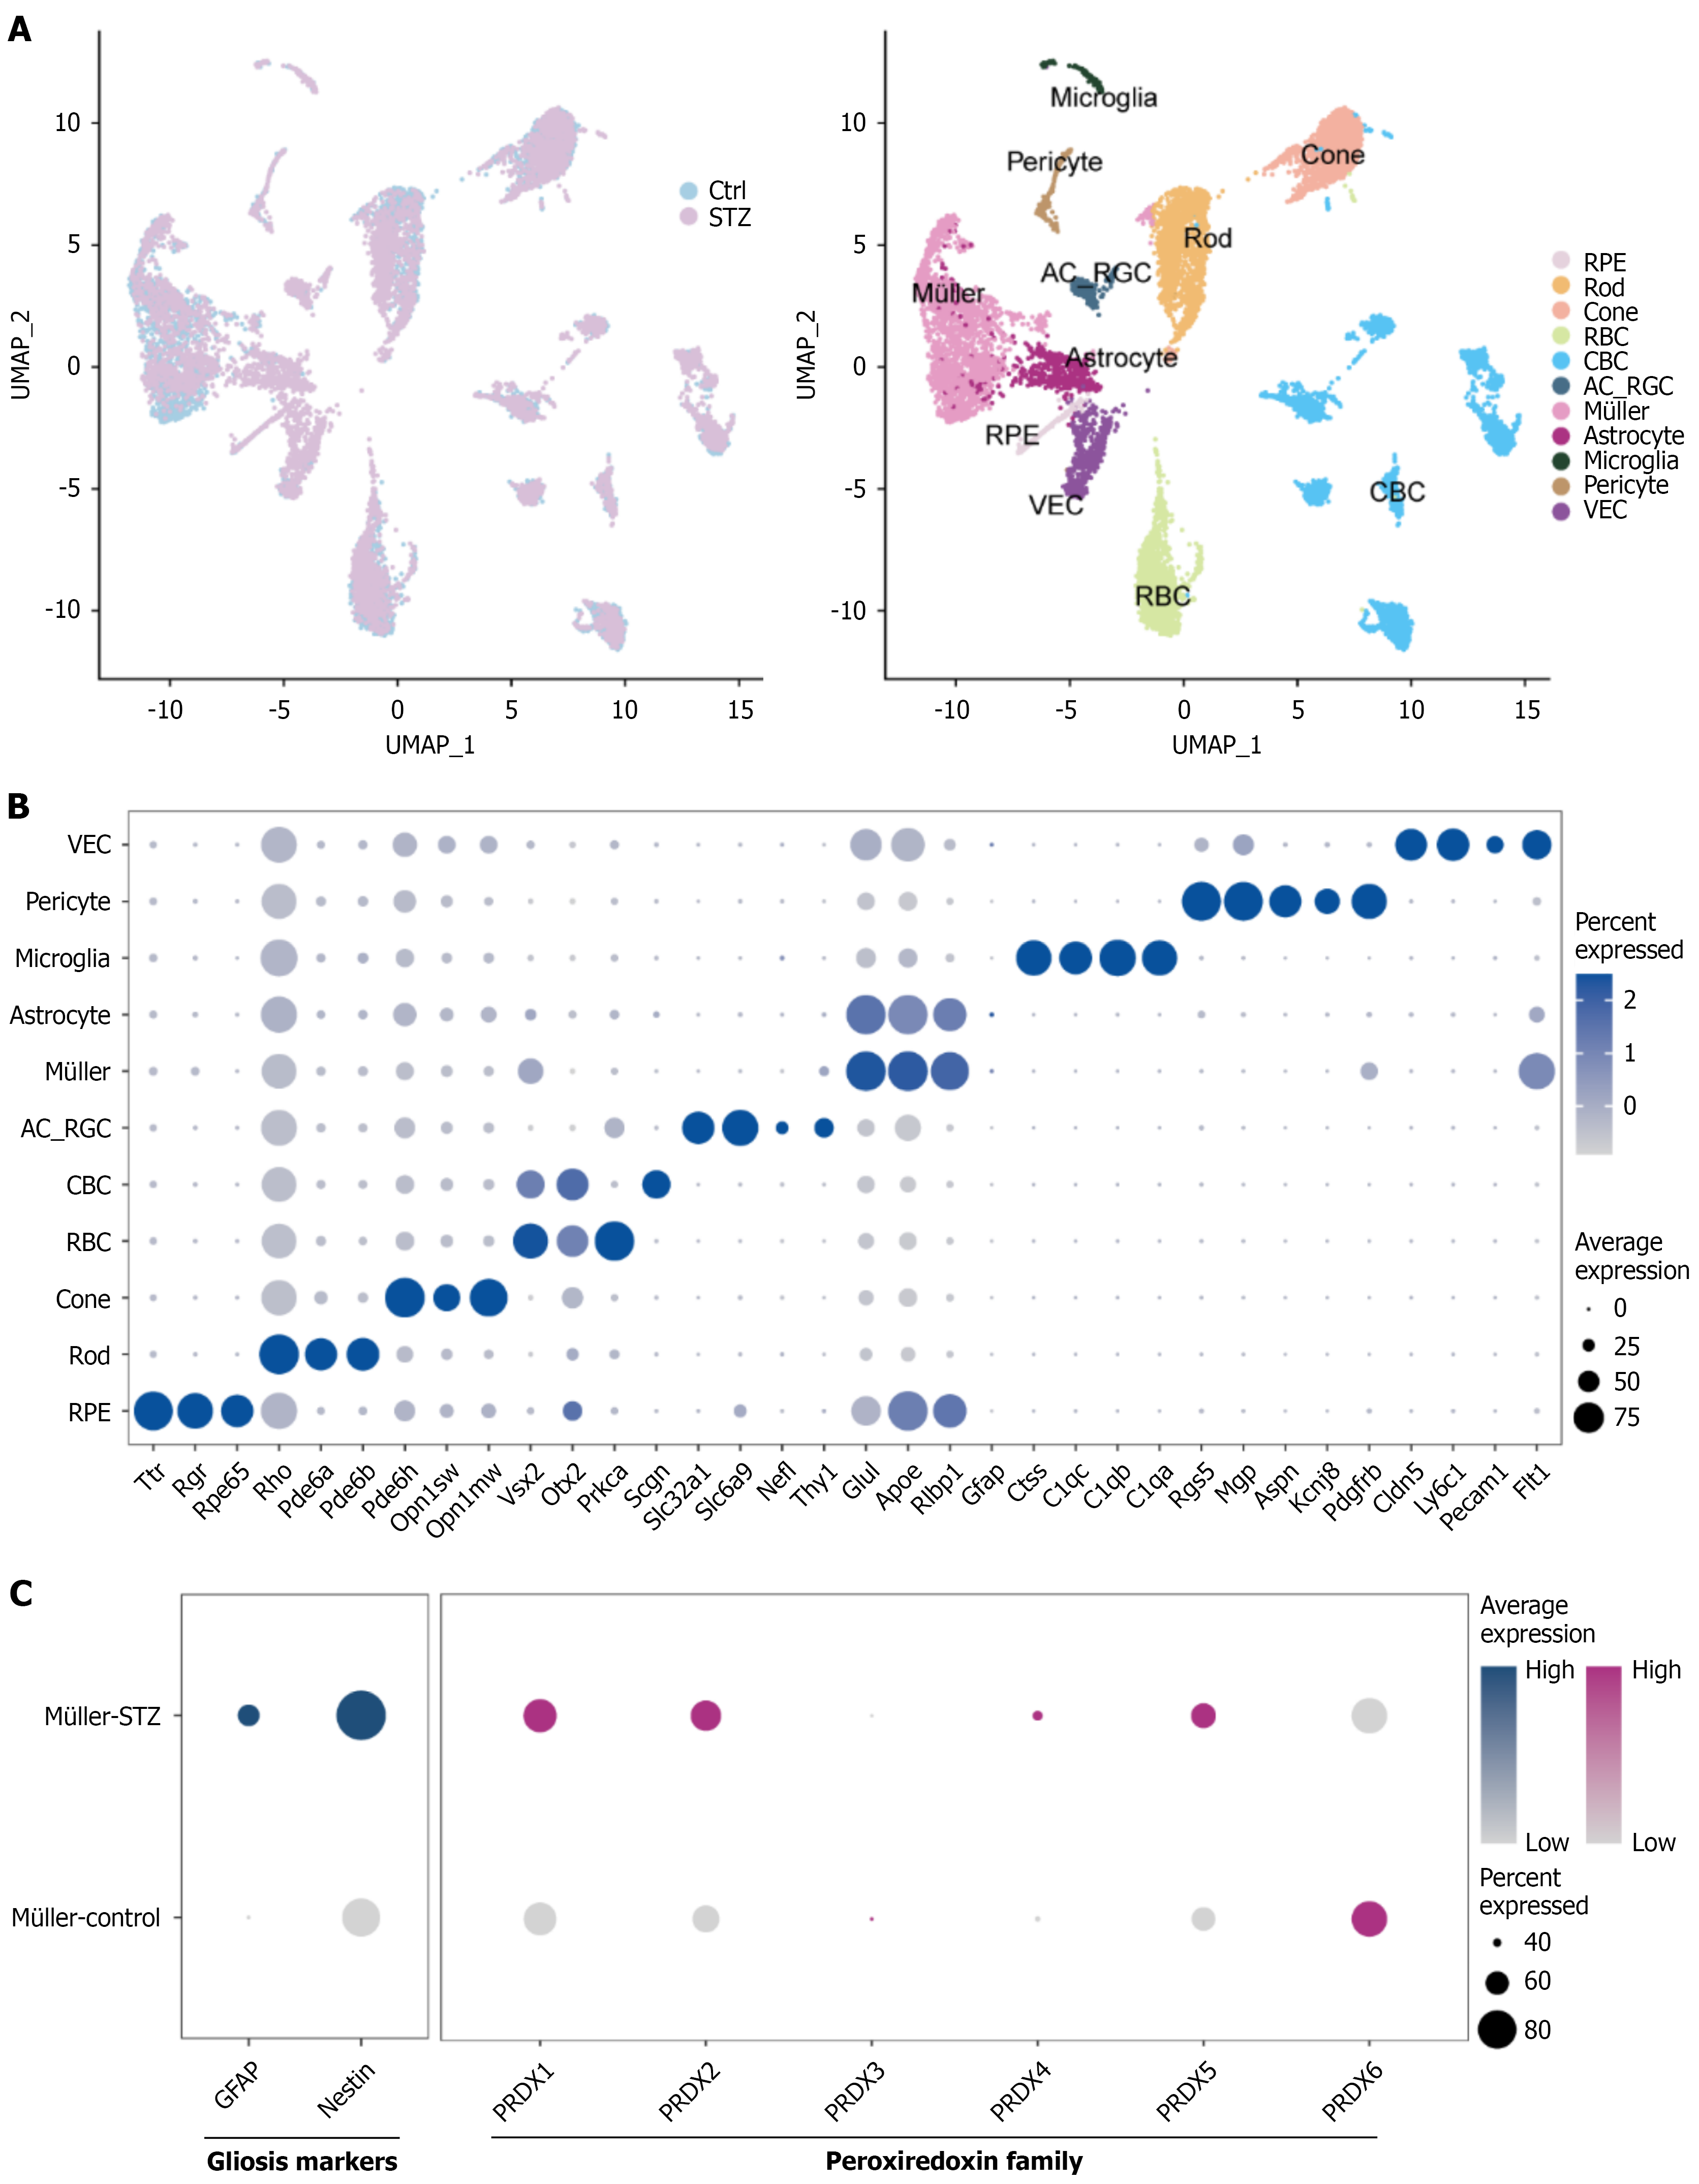
Figure 3 Single-cell transcriptomic profiling of diabetic murine retinas.
A: Uniform Manifold Approximation and Projection visualization of integrated retinal single-cell data from control vs streptozotocin (STZ)-induced diabetic mice (GEO: GSE178121). Left: Batch-corrected integration output. Right: Annotated clusters of 11 transcriptionally distinct retinal cell types; B: Dot plot representation of canonical retinal cell-type marker expression across clusters. Circle size indicates percentage of cells expressing the marker within each cluster; color intensity denotes average expression level (log-normalized counts); C: Differential expression heatmap of Müller gliosis markers (GFAP and nestin) and peroxiredoxin family genes (PRDX1-PRDX6) in Müller cells from STZ-diabetic vs control mice. The color scale represents the average expression level. STZ: Streptozotocin.
- Citation: Du XL, Ouyang S, Wang YS, Mao YS, Ren BC, Yu WH. PRDX2 silencing alleviates reactive hyperplasia of Müller glial cells in diabetic retinopathy by inhibiting the RhoA/ROCK signaling pathway. World J Diabetes 2026; 17(3): 115433
- URL: https://www.wjgnet.com/1948-9358/full/v17/i3/115433.htm
- DOI: https://dx.doi.org/10.4239/wjd.v17.i3.115433