
















Copyright: ©Author(s) 2026.
World J Diabetes. Mar 15, 2026; 17(3): 115433
Published online Mar 15, 2026. doi: 10.4239/wjd.v17.i3.115433
Published online Mar 15, 2026. doi: 10.4239/wjd.v17.i3.115433
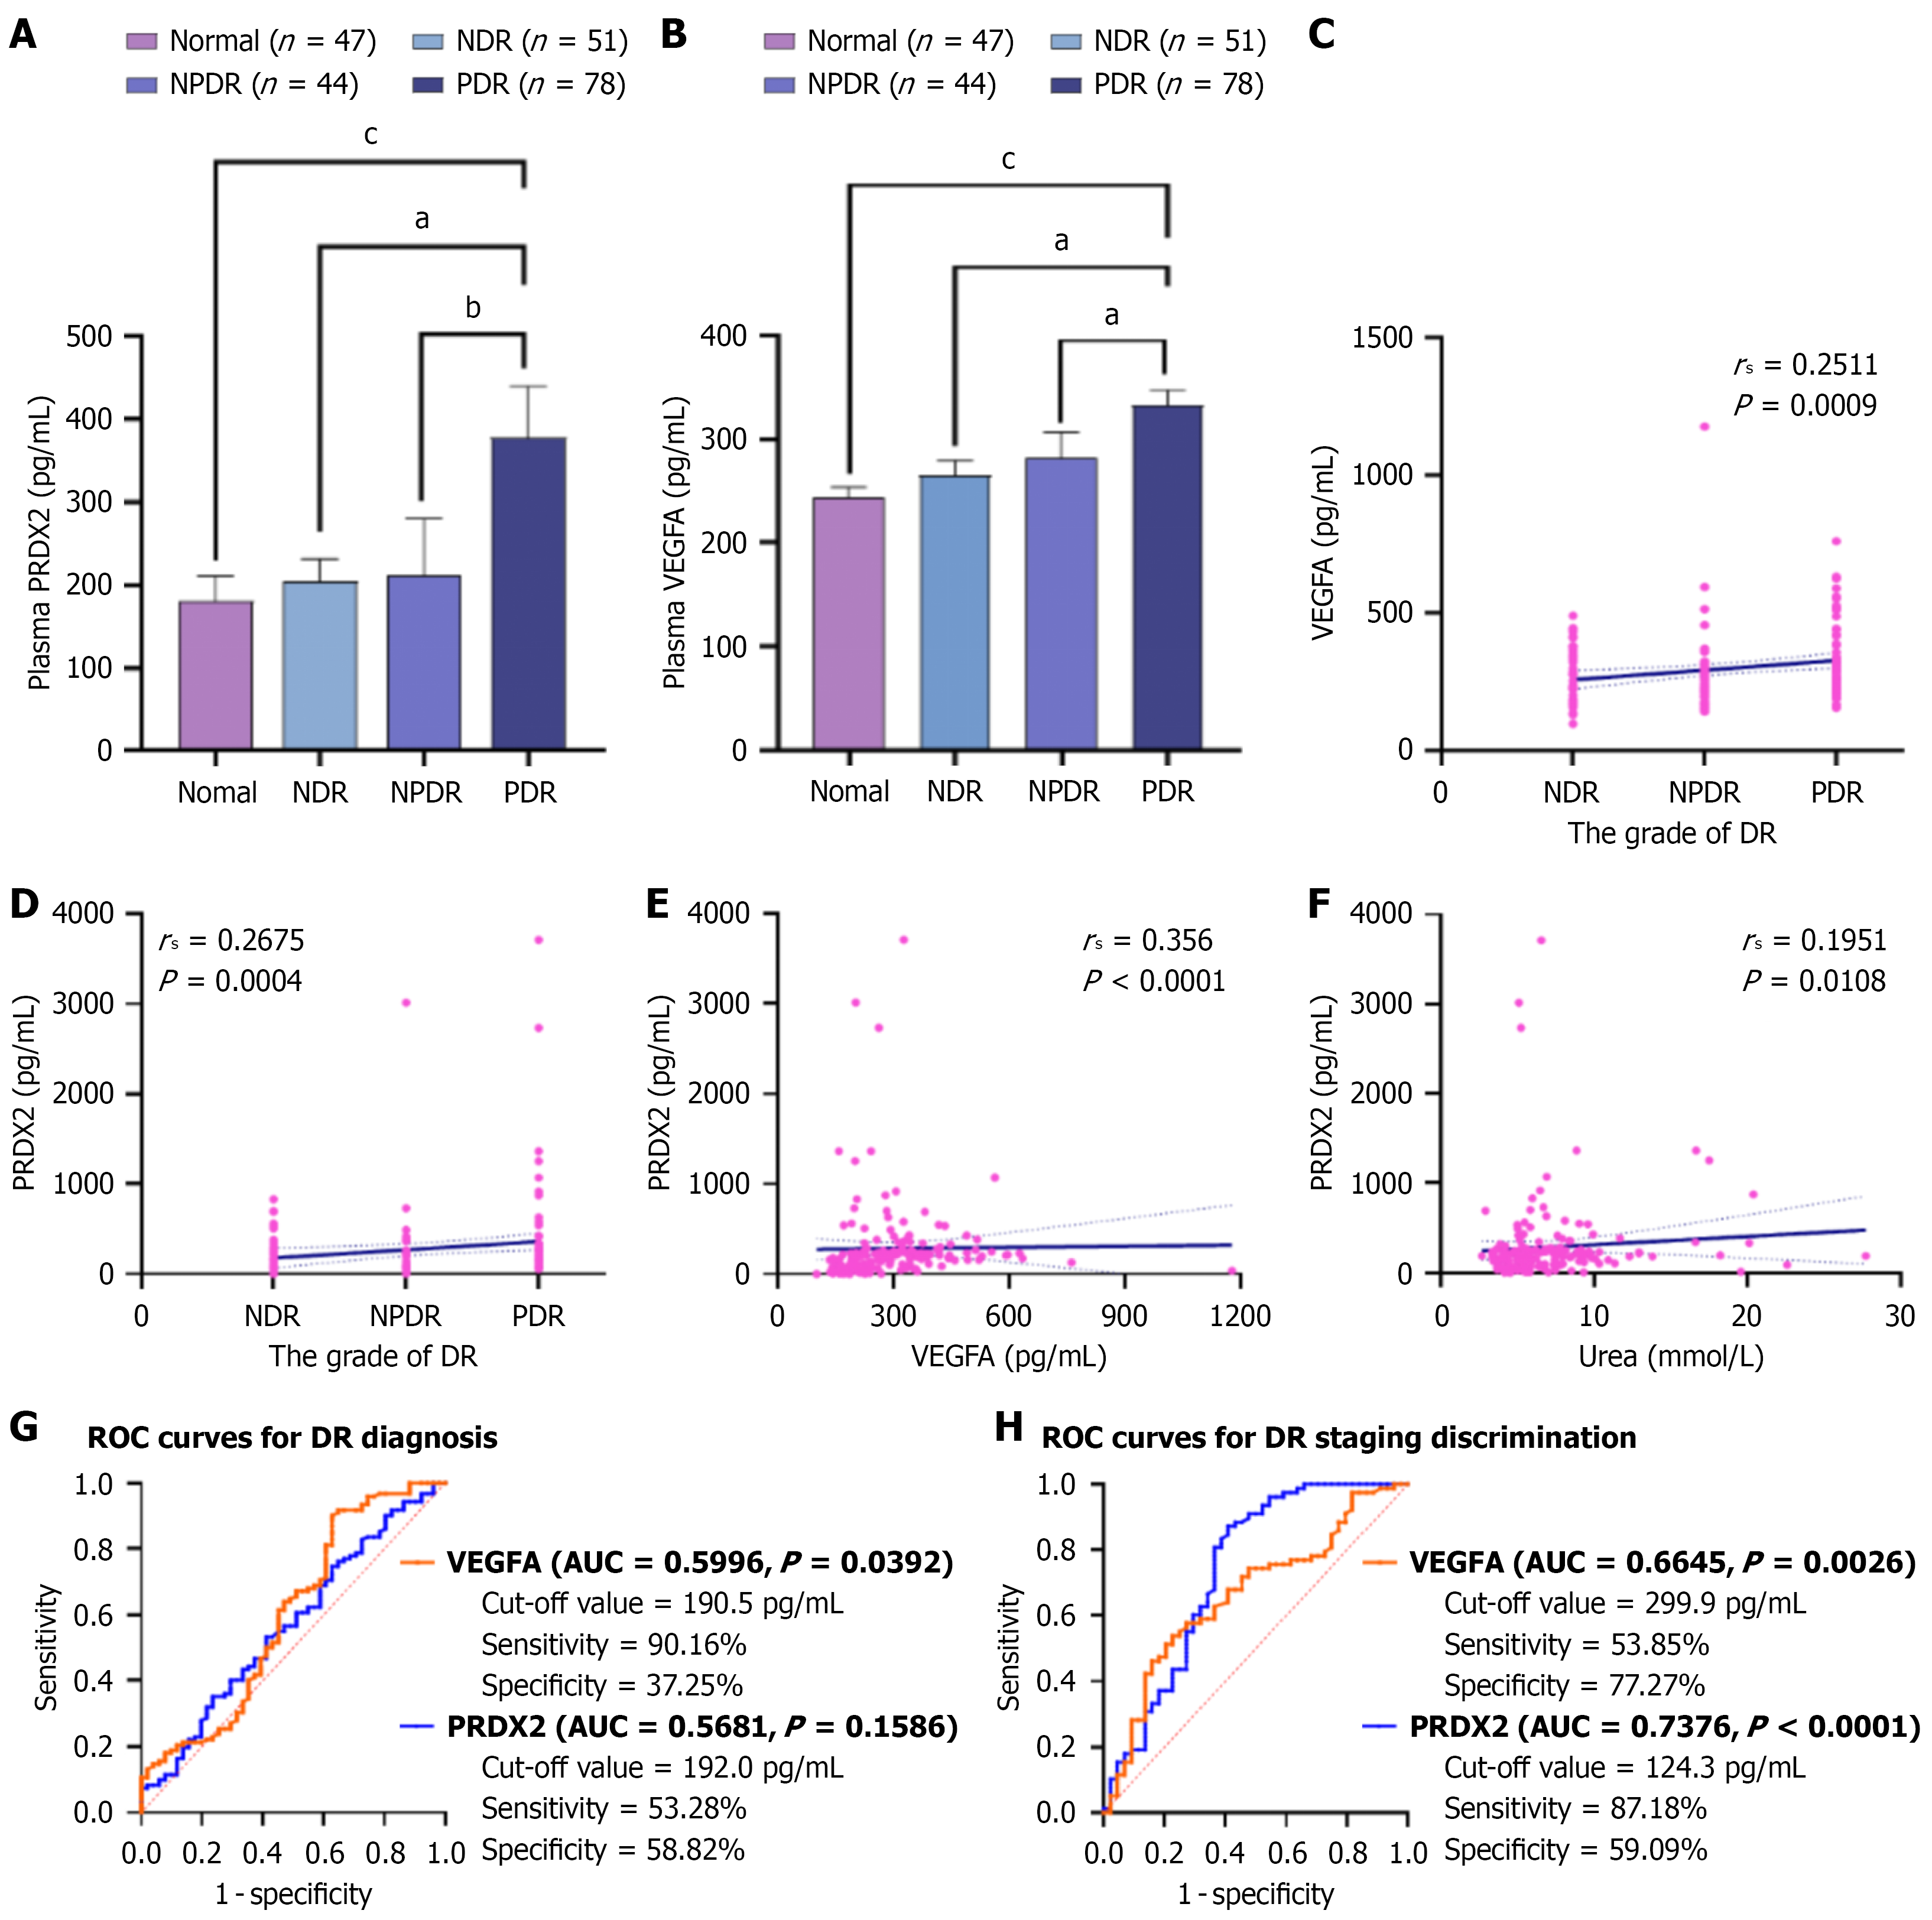
Figure 1 Biomarker profiling of plasma PPDX2 and vascular endothelial growth factor A in diabetic retinopathy progression.
A and B: Plasma PRDX2 and vascular endothelial growth factor A (VEGFA) concentrations across study cohorts: Healthy controls (normal, n = 47), non-diabetic retinopathy (n = 51), nonproliferative diabetic retinopathy (DR; n = 44), proliferative DR (n = 78). Kruskal-Wallis test for trend; C and D: Spearman correlations between DR severity and plasma VEGFA (C) or PRDX2 (D) levels; E and F: Spearman correlations between plasma PRDX2 and plasma VEGFA (E) or serum urea (F); G: Receiver operating characteristic (ROC) curves for DR diagnosis using plasma VEGFA [area under the curve (AUC) = 0.5996] and PRDX2 (AUC = 0.5681) in the diabetic cohort (n = 173); H: ROC curves for DR staging discrimination using plasma VEGFA (AUC = 0.6645) and PRDX2 (AUC = 0.7376) in confirmed DR cases (n = 122). aP < 0.05; bP < 0.0001; cP < 0.001. DR: Diabetic retinopathy; NDR: Non-diabetic retinopathy; PDR: Proliferative diabetic retinopathy; NPDR: Non-proliferative diabetic retinopathy; VEGFA: Vascular endothelial growth factor; ROC: Receiver operating characteristic; DR: Diabetic retinopathy; AUC: Area under the curve.
- Citation: Du XL, Ouyang S, Wang YS, Mao YS, Ren BC, Yu WH. PRDX2 silencing alleviates reactive hyperplasia of Müller glial cells in diabetic retinopathy by inhibiting the RhoA/ROCK signaling pathway. World J Diabetes 2026; 17(3): 115433
- URL: https://www.wjgnet.com/1948-9358/full/v17/i3/115433.htm
- DOI: https://dx.doi.org/10.4239/wjd.v17.i3.115433