
















Copyright: ©Author(s) 2026.
World J Diabetes. Mar 15, 2026; 17(3): 112177
Published online Mar 15, 2026. doi: 10.4239/wjd.v17.i3.112177
Published online Mar 15, 2026. doi: 10.4239/wjd.v17.i3.112177
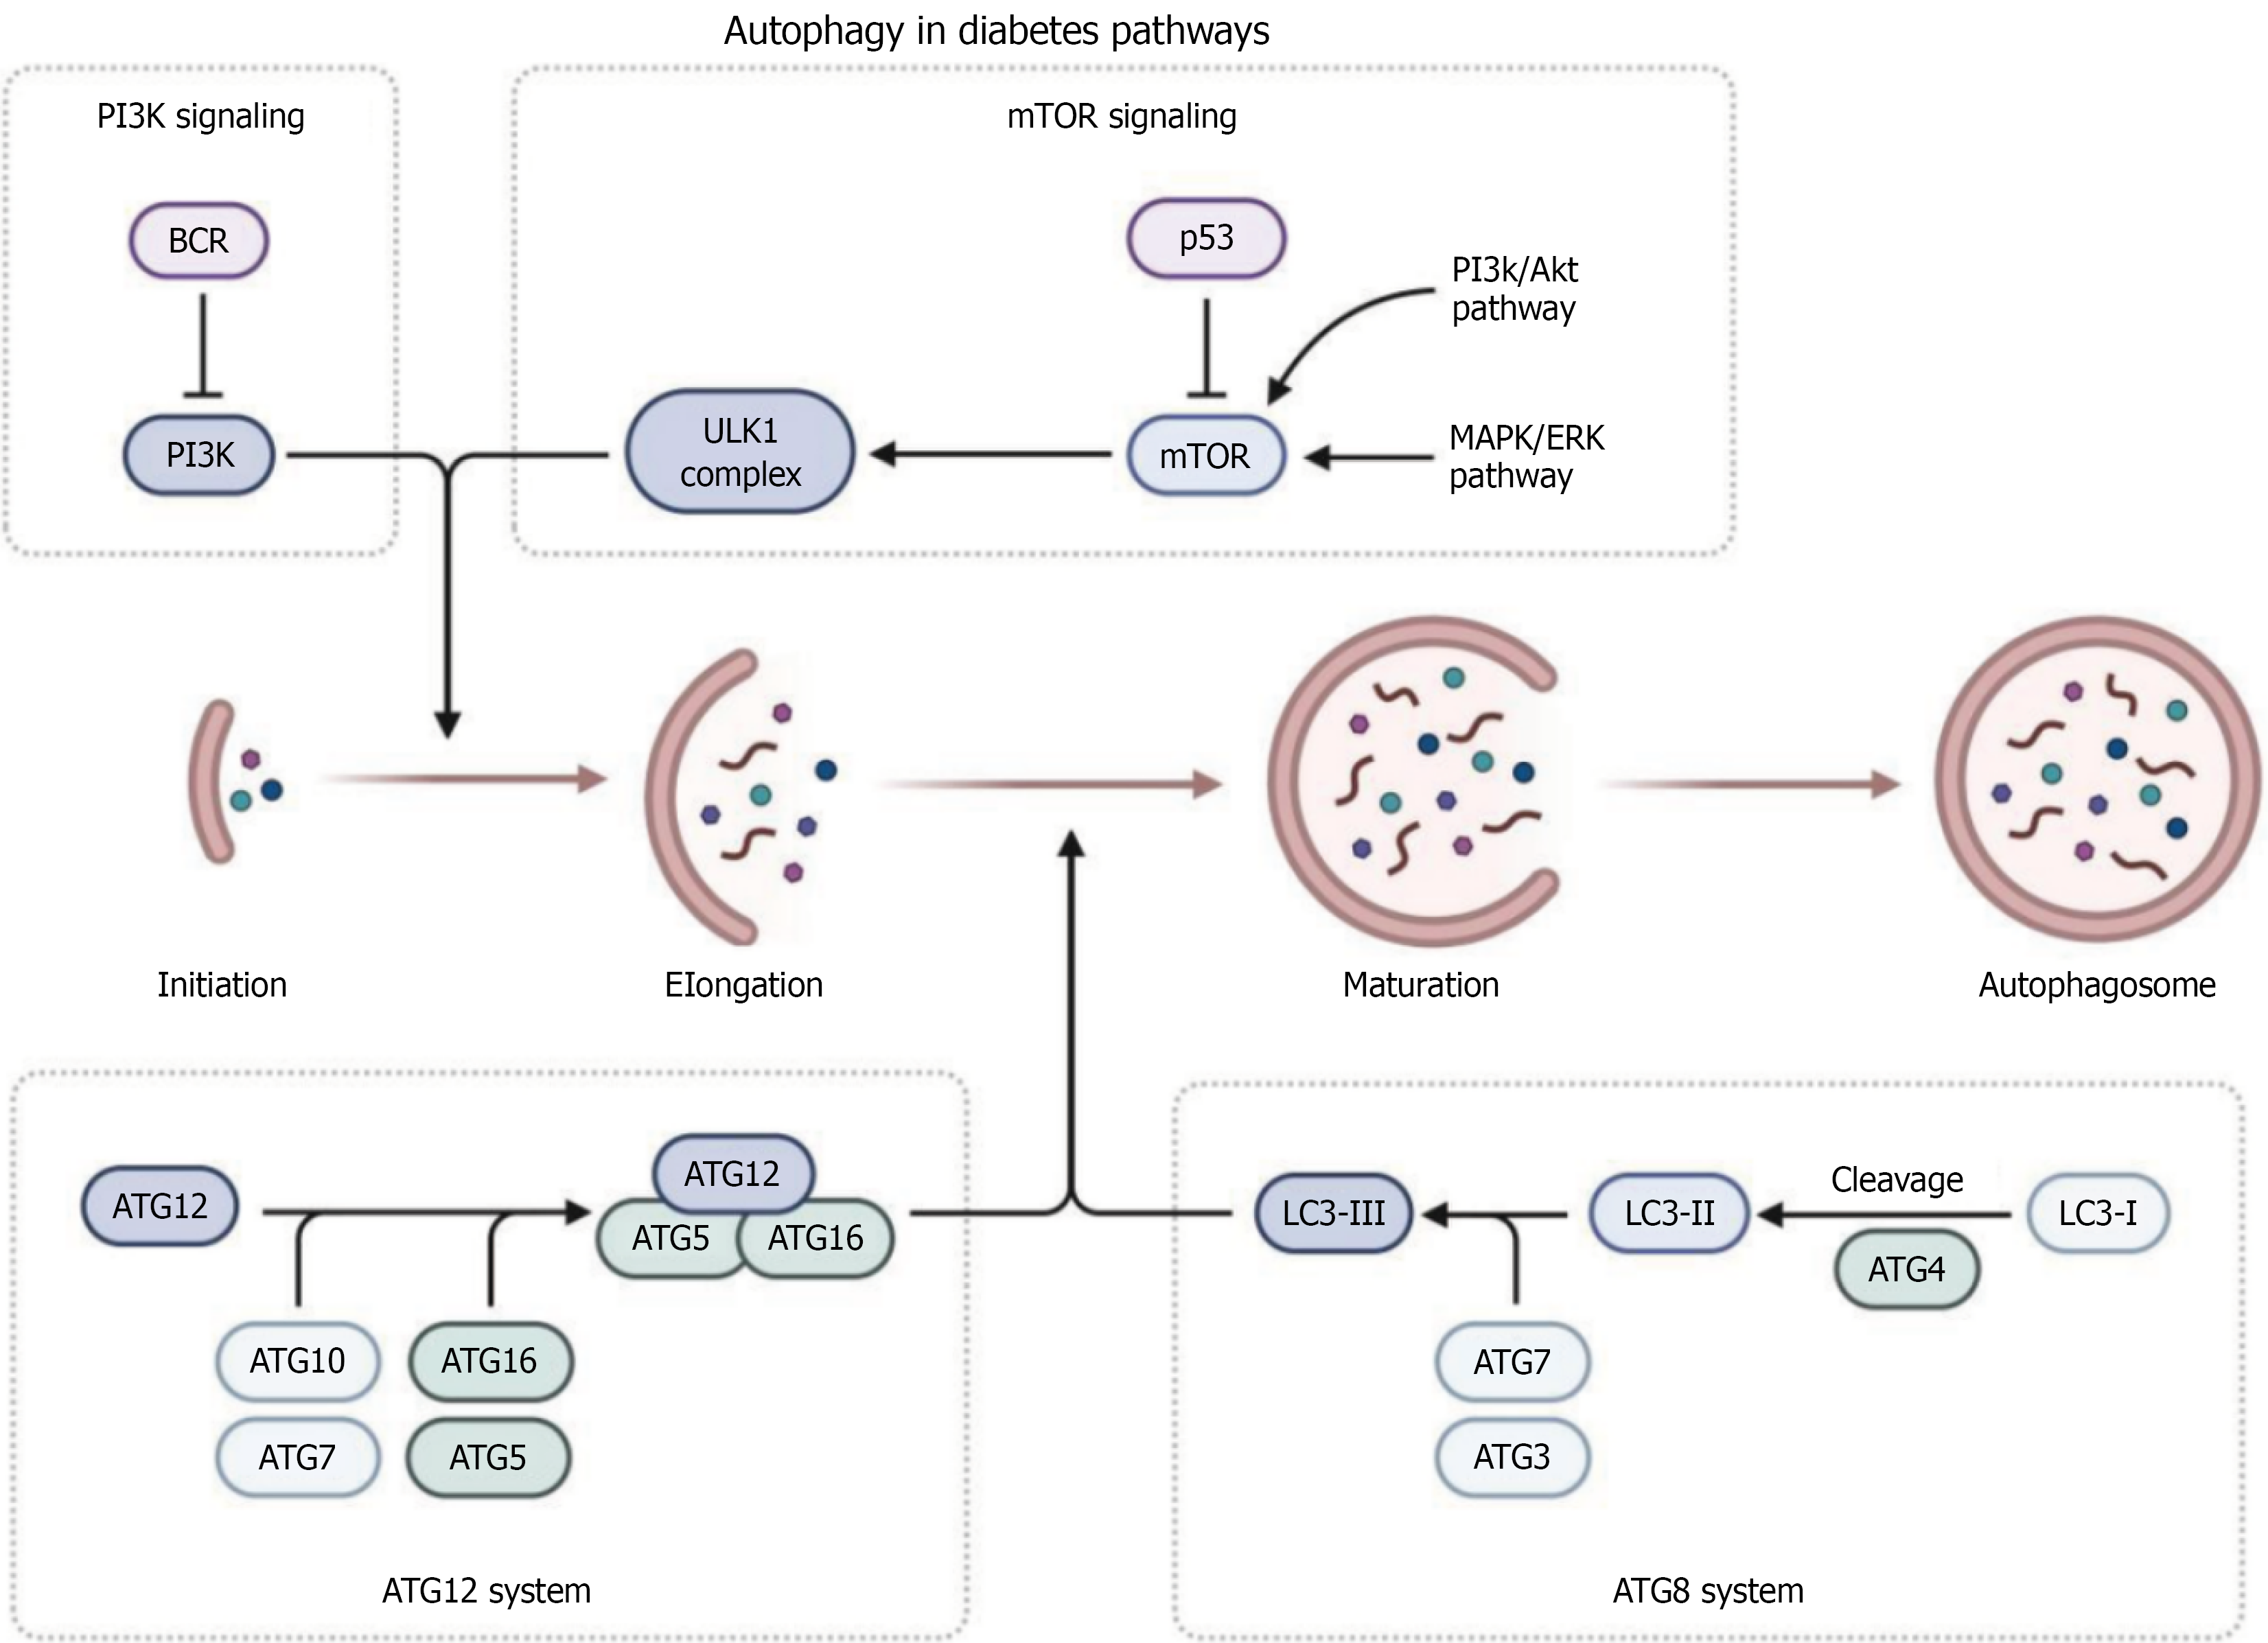
Figure 4 Autophagy signaling pathways and molecular machinery in diabetes.
The diagram illustrates the key regulatory mechanisms controlling autophagy under diabetic conditions (upper panel). Two major signaling pathways regulate autophagy initiation: The PI3K signaling pathway (left), which involves BCR, PI3K, and the ULK1 complex, and the mTOR signaling pathway (right), which involves p53, mTOR, and downstream PI3K/AKT and MAPK/ERK pathways that respond to cellular stress and nutrient availability (middle panel). The autophagy process proceeds through four sequential stages: Initiation of phagophore formation, elongation of the isolation membrane, maturation into a complete autophagosome, and finally, autophagosome formation (lower panel). Two critical molecular systems execute autophagy: The ATG12 system (left), involving ATG12, ATG5, and ATG16 L conjugation through ATG10, ATG16, and ATG7, and the ATG8 system (right), featuring LC3 processing from LC3-I to LC3-II through ATG4-mediated cleavage and ATG7/ATG3-dependent conjugation. This molecular machinery is essential for autophagosome formation and is frequently dysregulated in diabetic conditions, contributing to impaired cellular quality control and metabolic dysfunction. This figure was created by BioRender.com (Supplementary material).
- Citation: Chen X, Zhang LL, Zhou Y, Dong DX, Qian XY. Mitochondrial autophagy in diabetes-related cognitive decline and skin ulcers: Mechanistic insights and therapeutic implications. World J Diabetes 2026; 17(3): 112177
- URL: https://www.wjgnet.com/1948-9358/full/v17/i3/112177.htm
- DOI: https://dx.doi.org/10.4239/wjd.v17.i3.112177