
















©The Author(s) 2026.
World J Diabetes. Feb 15, 2026; 17(2): 115495
Published online Feb 15, 2026. doi: 10.4239/wjd.v17.i2.115495
Published online Feb 15, 2026. doi: 10.4239/wjd.v17.i2.115495
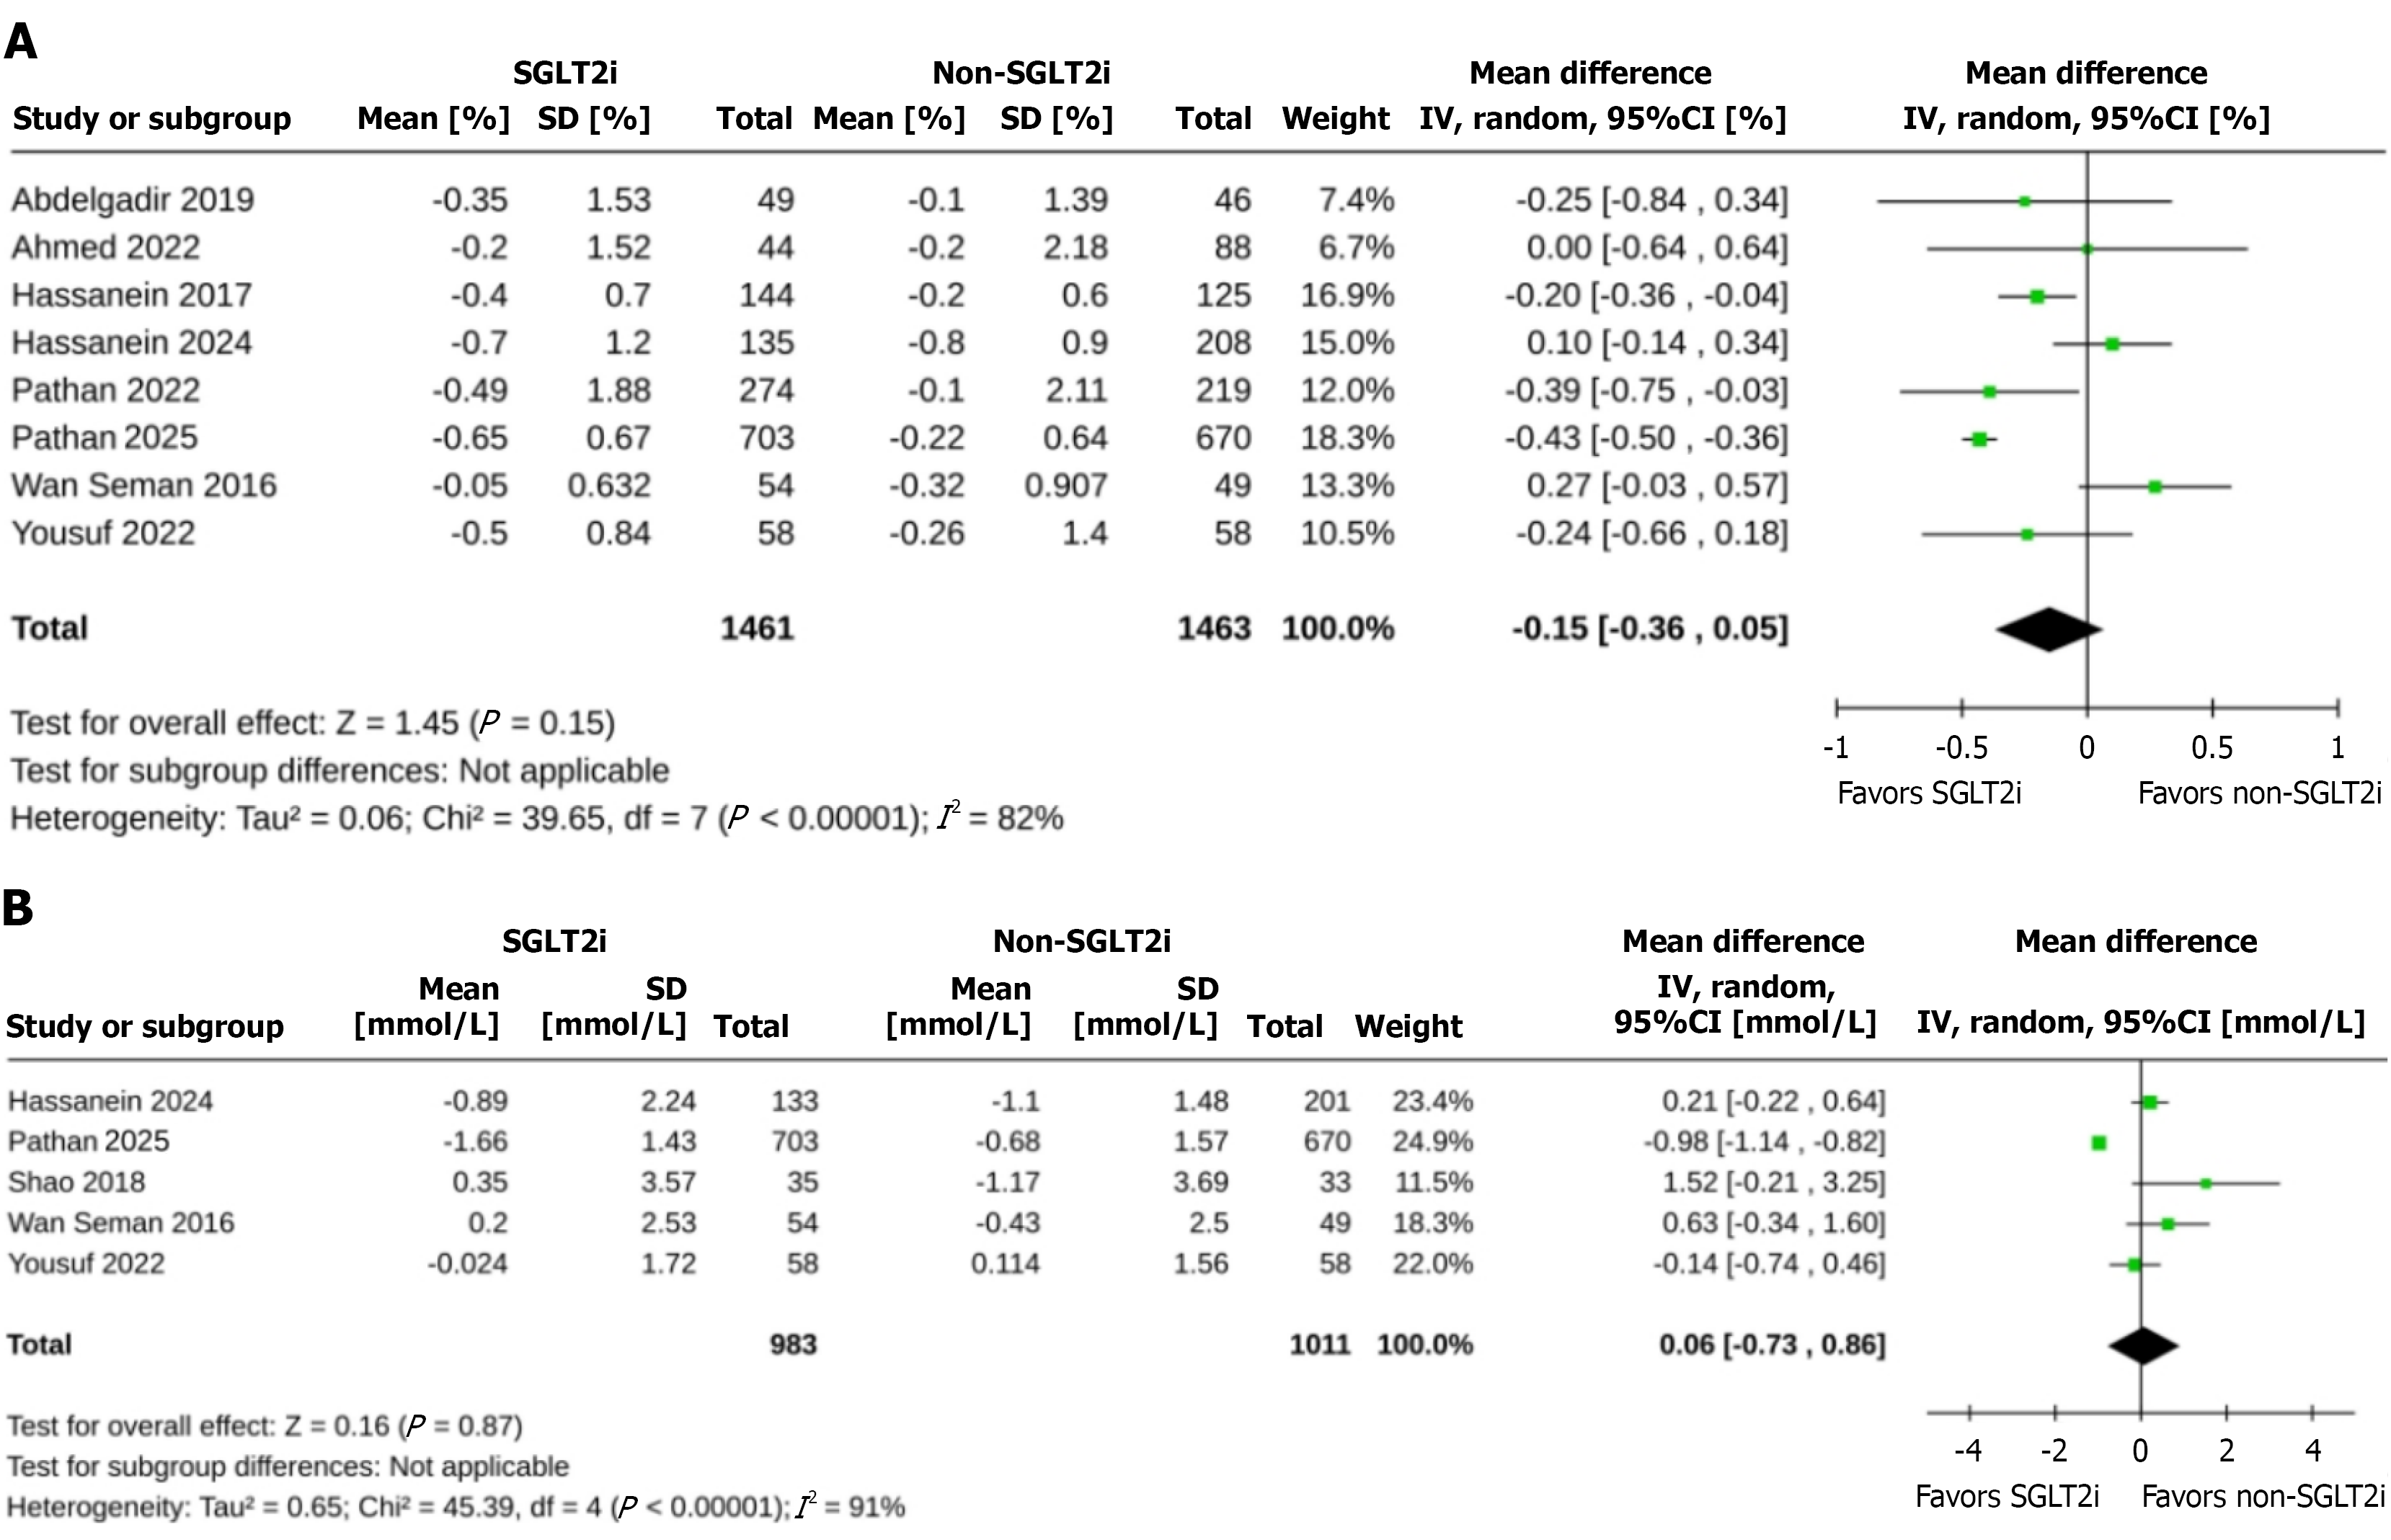
Figure 2 Forest plot demonstrating the mean differences in glycated hemoglobin and fasting plasma glucose in the sodium-glucose cotransporter-2 inhibitors group vs the non-sodium-glucose cotransporter-2 inhibitors group.
A: Glycated hemoglobin; B: Fasting plasma glucose. SGLT2i: Sodium-glucose cotransporter-2 inhibitors.
- Citation: Kamrul-Hasan ABM, Shaikh S, Ashraf H, Kuchay MS, Nagendra L, Dutta D, Pappachan JM. Safety and efficacy of sodium-glucose cotransporter-2 inhibitors in adults with type 2 diabetes fasting during Ramadan: A meta-analysis. World J Diabetes 2026; 17(2): 115495
- URL: https://www.wjgnet.com/1948-9358/full/v17/i2/115495.htm
- DOI: https://dx.doi.org/10.4239/wjd.v17.i2.115495