
















©The Author(s) 2026.
World J Diabetes. Feb 15, 2026; 17(2): 114252
Published online Feb 15, 2026. doi: 10.4239/wjd.v17.i2.114252
Published online Feb 15, 2026. doi: 10.4239/wjd.v17.i2.114252
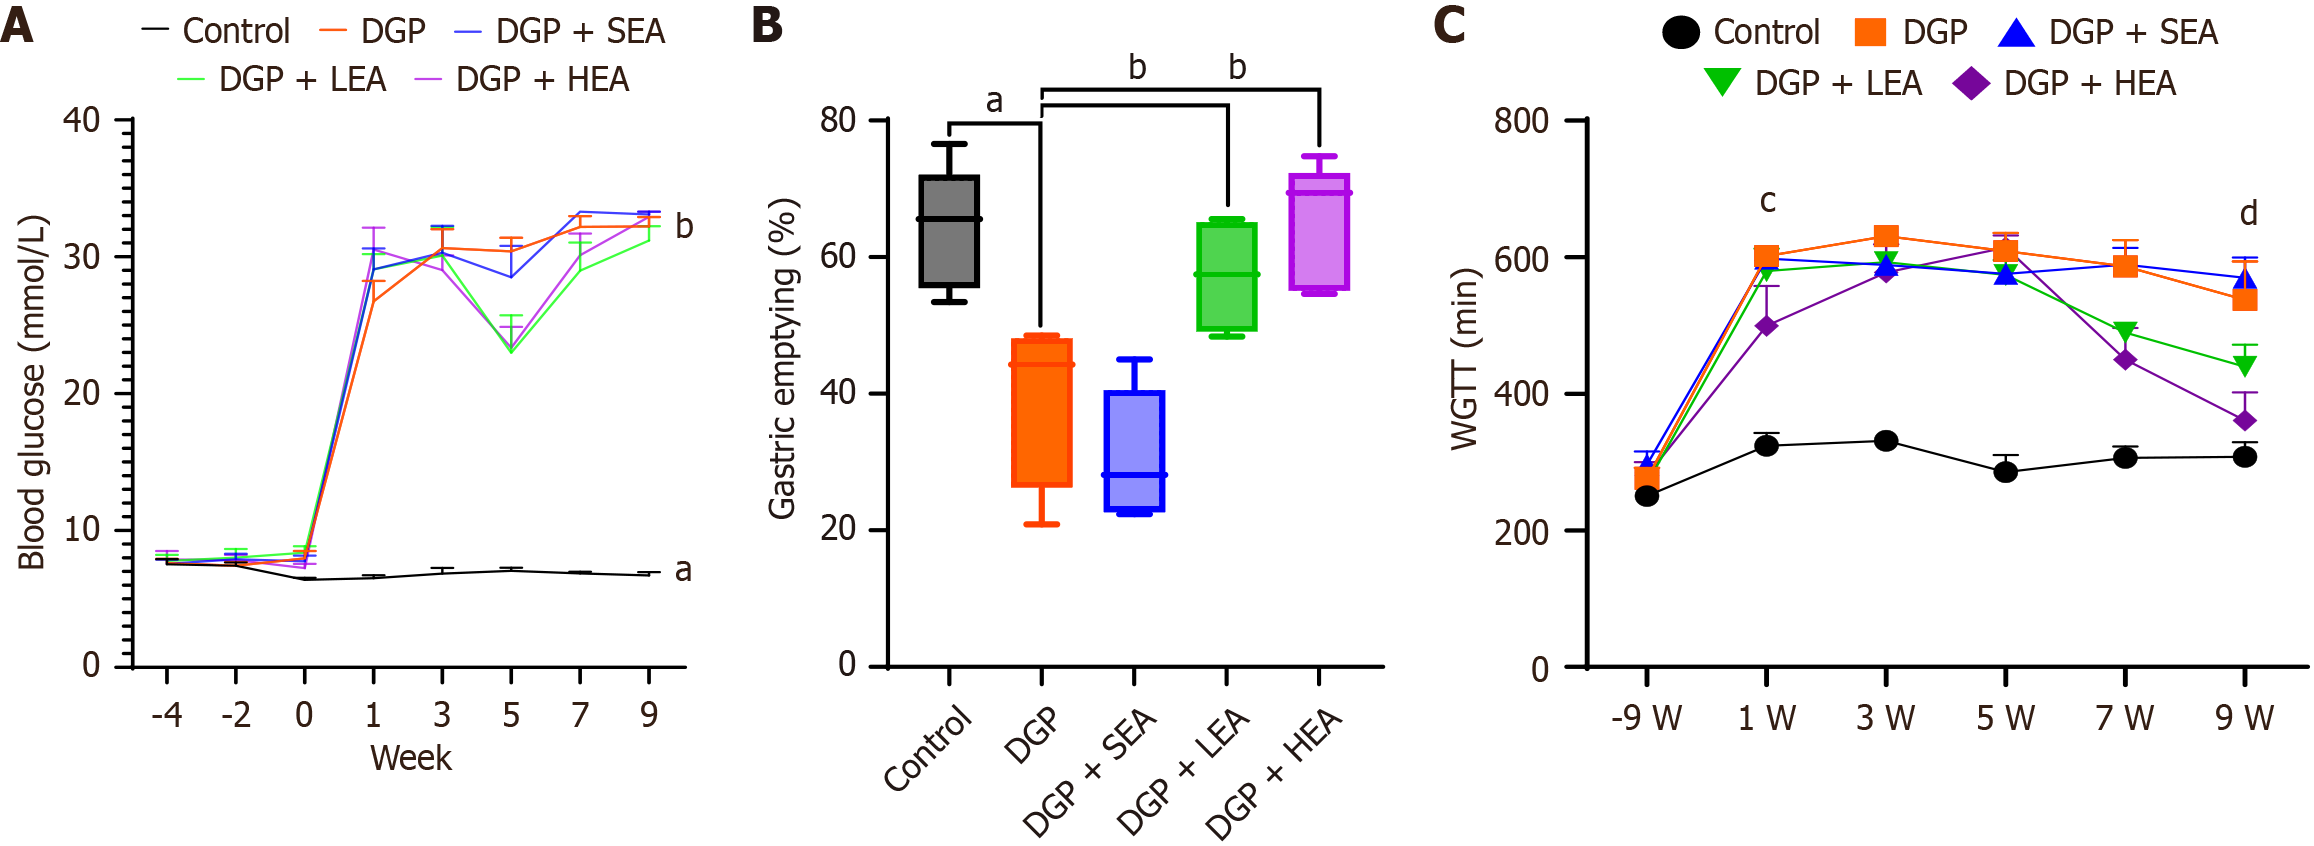
Figure 3 Effects of electroacupuncture on blood glucose, whole-gut transit time, and gastric emptying rate.
A: Changes in blood glucose levels following electroacupuncture (EA) treatment; B: Effects of EA on gastric emptying rate; C: Effects of EA on whole-gut transit time. Error bars indicate SEM in A and C. The box plot in B depicts the median (center line), interquartile range (box bounds), and whiskers extending to the furthest data point within 1.5 × interquartile range. aP < 0.05 vs control group, bP < 0.05 vs diabetic gastroparesis group, cP < 0.01 vs diabetic gastroparesis group, and dP < 0.05 vs high-frequency electroacupuncture group at 9 weeks. DGP: Diabetic gastroparesis; SEA: Sham-electroacupuncture; LEA: Low-frequency electroacupuncture; HEA: High-frequency electroacupuncture; WGTT: Whole-gut transit time.
- Citation: Fan MW, Tian JL, Zhang SH, Zhao ZJ, Liu XR, Liu CX, Chen Y. Electroacupuncture protects gastric Cajal cells by reducing macrophage pyroptosis in diabetic gastroparesis. World J Diabetes 2026; 17(2): 114252
- URL: https://www.wjgnet.com/1948-9358/full/v17/i2/114252.htm
- DOI: https://dx.doi.org/10.4239/wjd.v17.i2.114252