
















©The Author(s) 2026.
World J Diabetes. Feb 15, 2026; 17(2): 113992
Published online Feb 15, 2026. doi: 10.4239/wjd.v17.i2.113992
Published online Feb 15, 2026. doi: 10.4239/wjd.v17.i2.113992
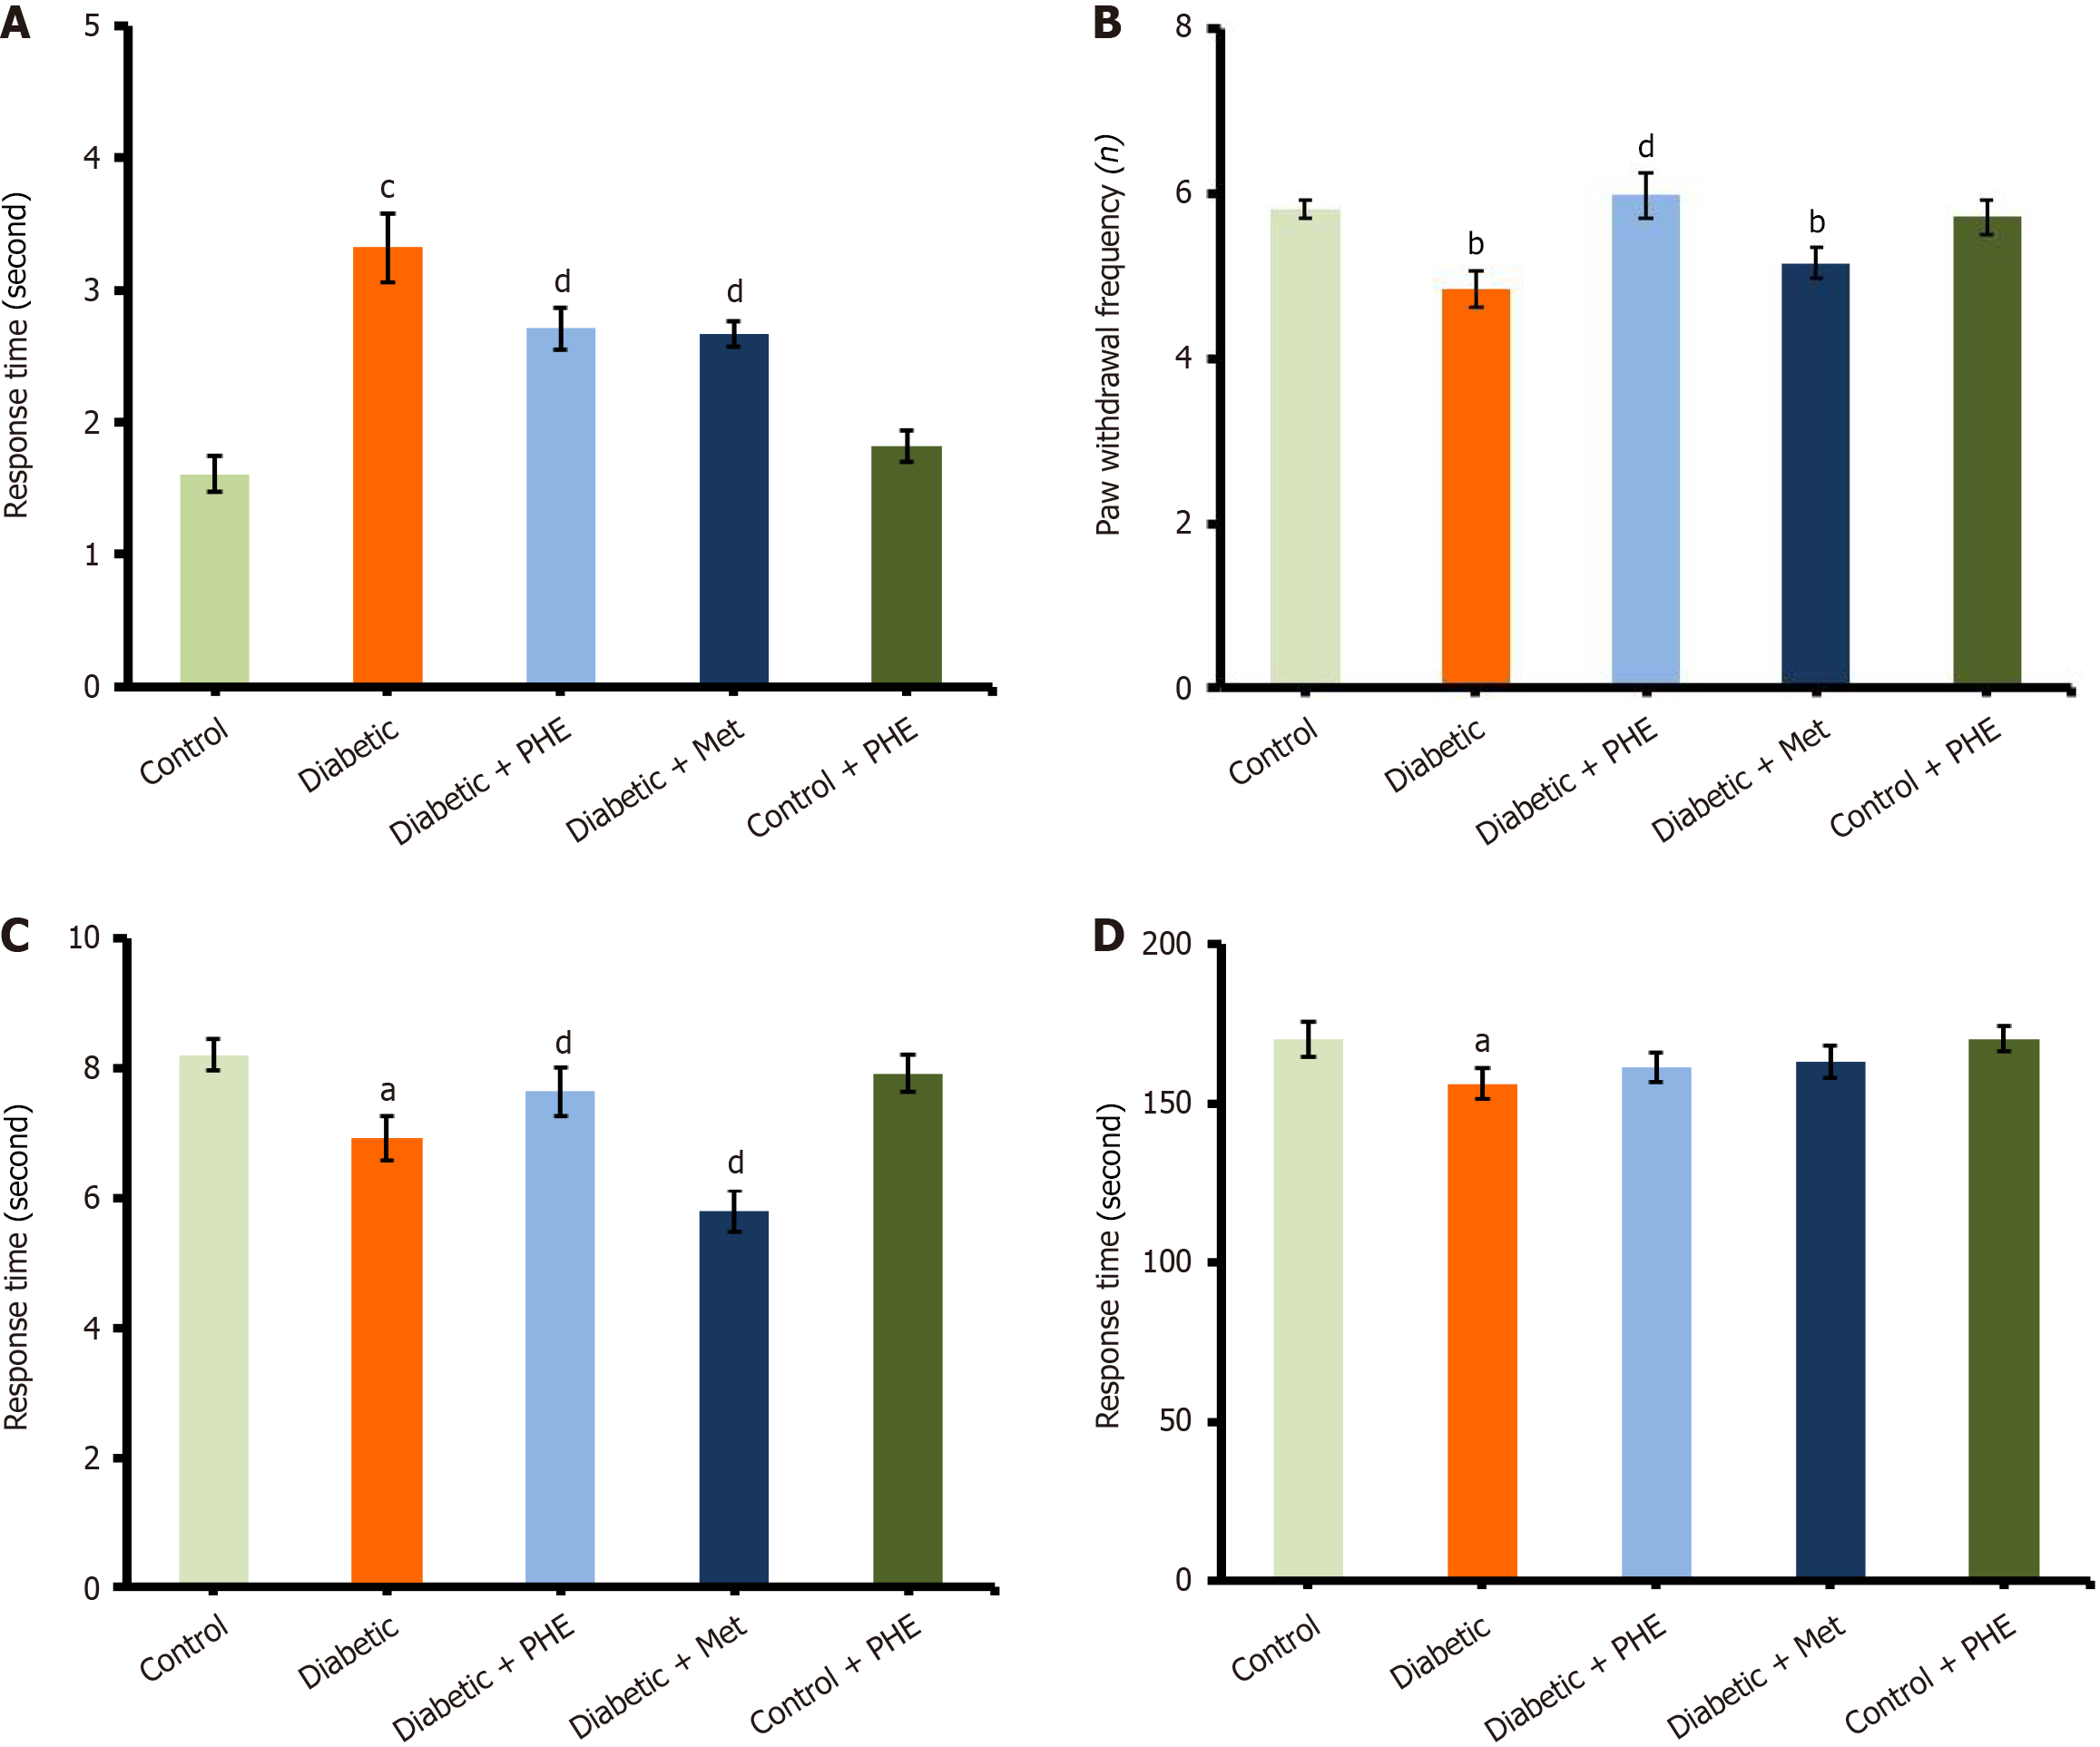
Figure 2 Effects on behavioral tests.
A: Acetone drop test; B: Hot plate test; C: Tail-flick test; D: Rotarod test. Data are expressed as mean ± SEM (n = 7). aP < 0.05 vs control group, bP < 0.01 vs control group, cP < 0.001 vs control group, dP < 0.05 vs diabetic group. Met: Metformin; PHE: Polyherbal extract.
- Citation: Kausar MA, Parveen K, Anwar S, Khan YS, Saleh AA, Ahmed MAA, Siddiqui WA, Parvez S. Neuroprotective potential of a plant-based intervention in diabetic neuropathy: Biochemical and behavioral insights from a streptozotocin-induced rat model. World J Diabetes 2026; 17(2): 113992
- URL: https://www.wjgnet.com/1948-9358/full/v17/i2/113992.htm
- DOI: https://dx.doi.org/10.4239/wjd.v17.i2.113992