
















©The Author(s) 2026.
World J Diabetes. Feb 15, 2026; 17(2): 112859
Published online Feb 15, 2026. doi: 10.4239/wjd.v17.i2.112859
Published online Feb 15, 2026. doi: 10.4239/wjd.v17.i2.112859
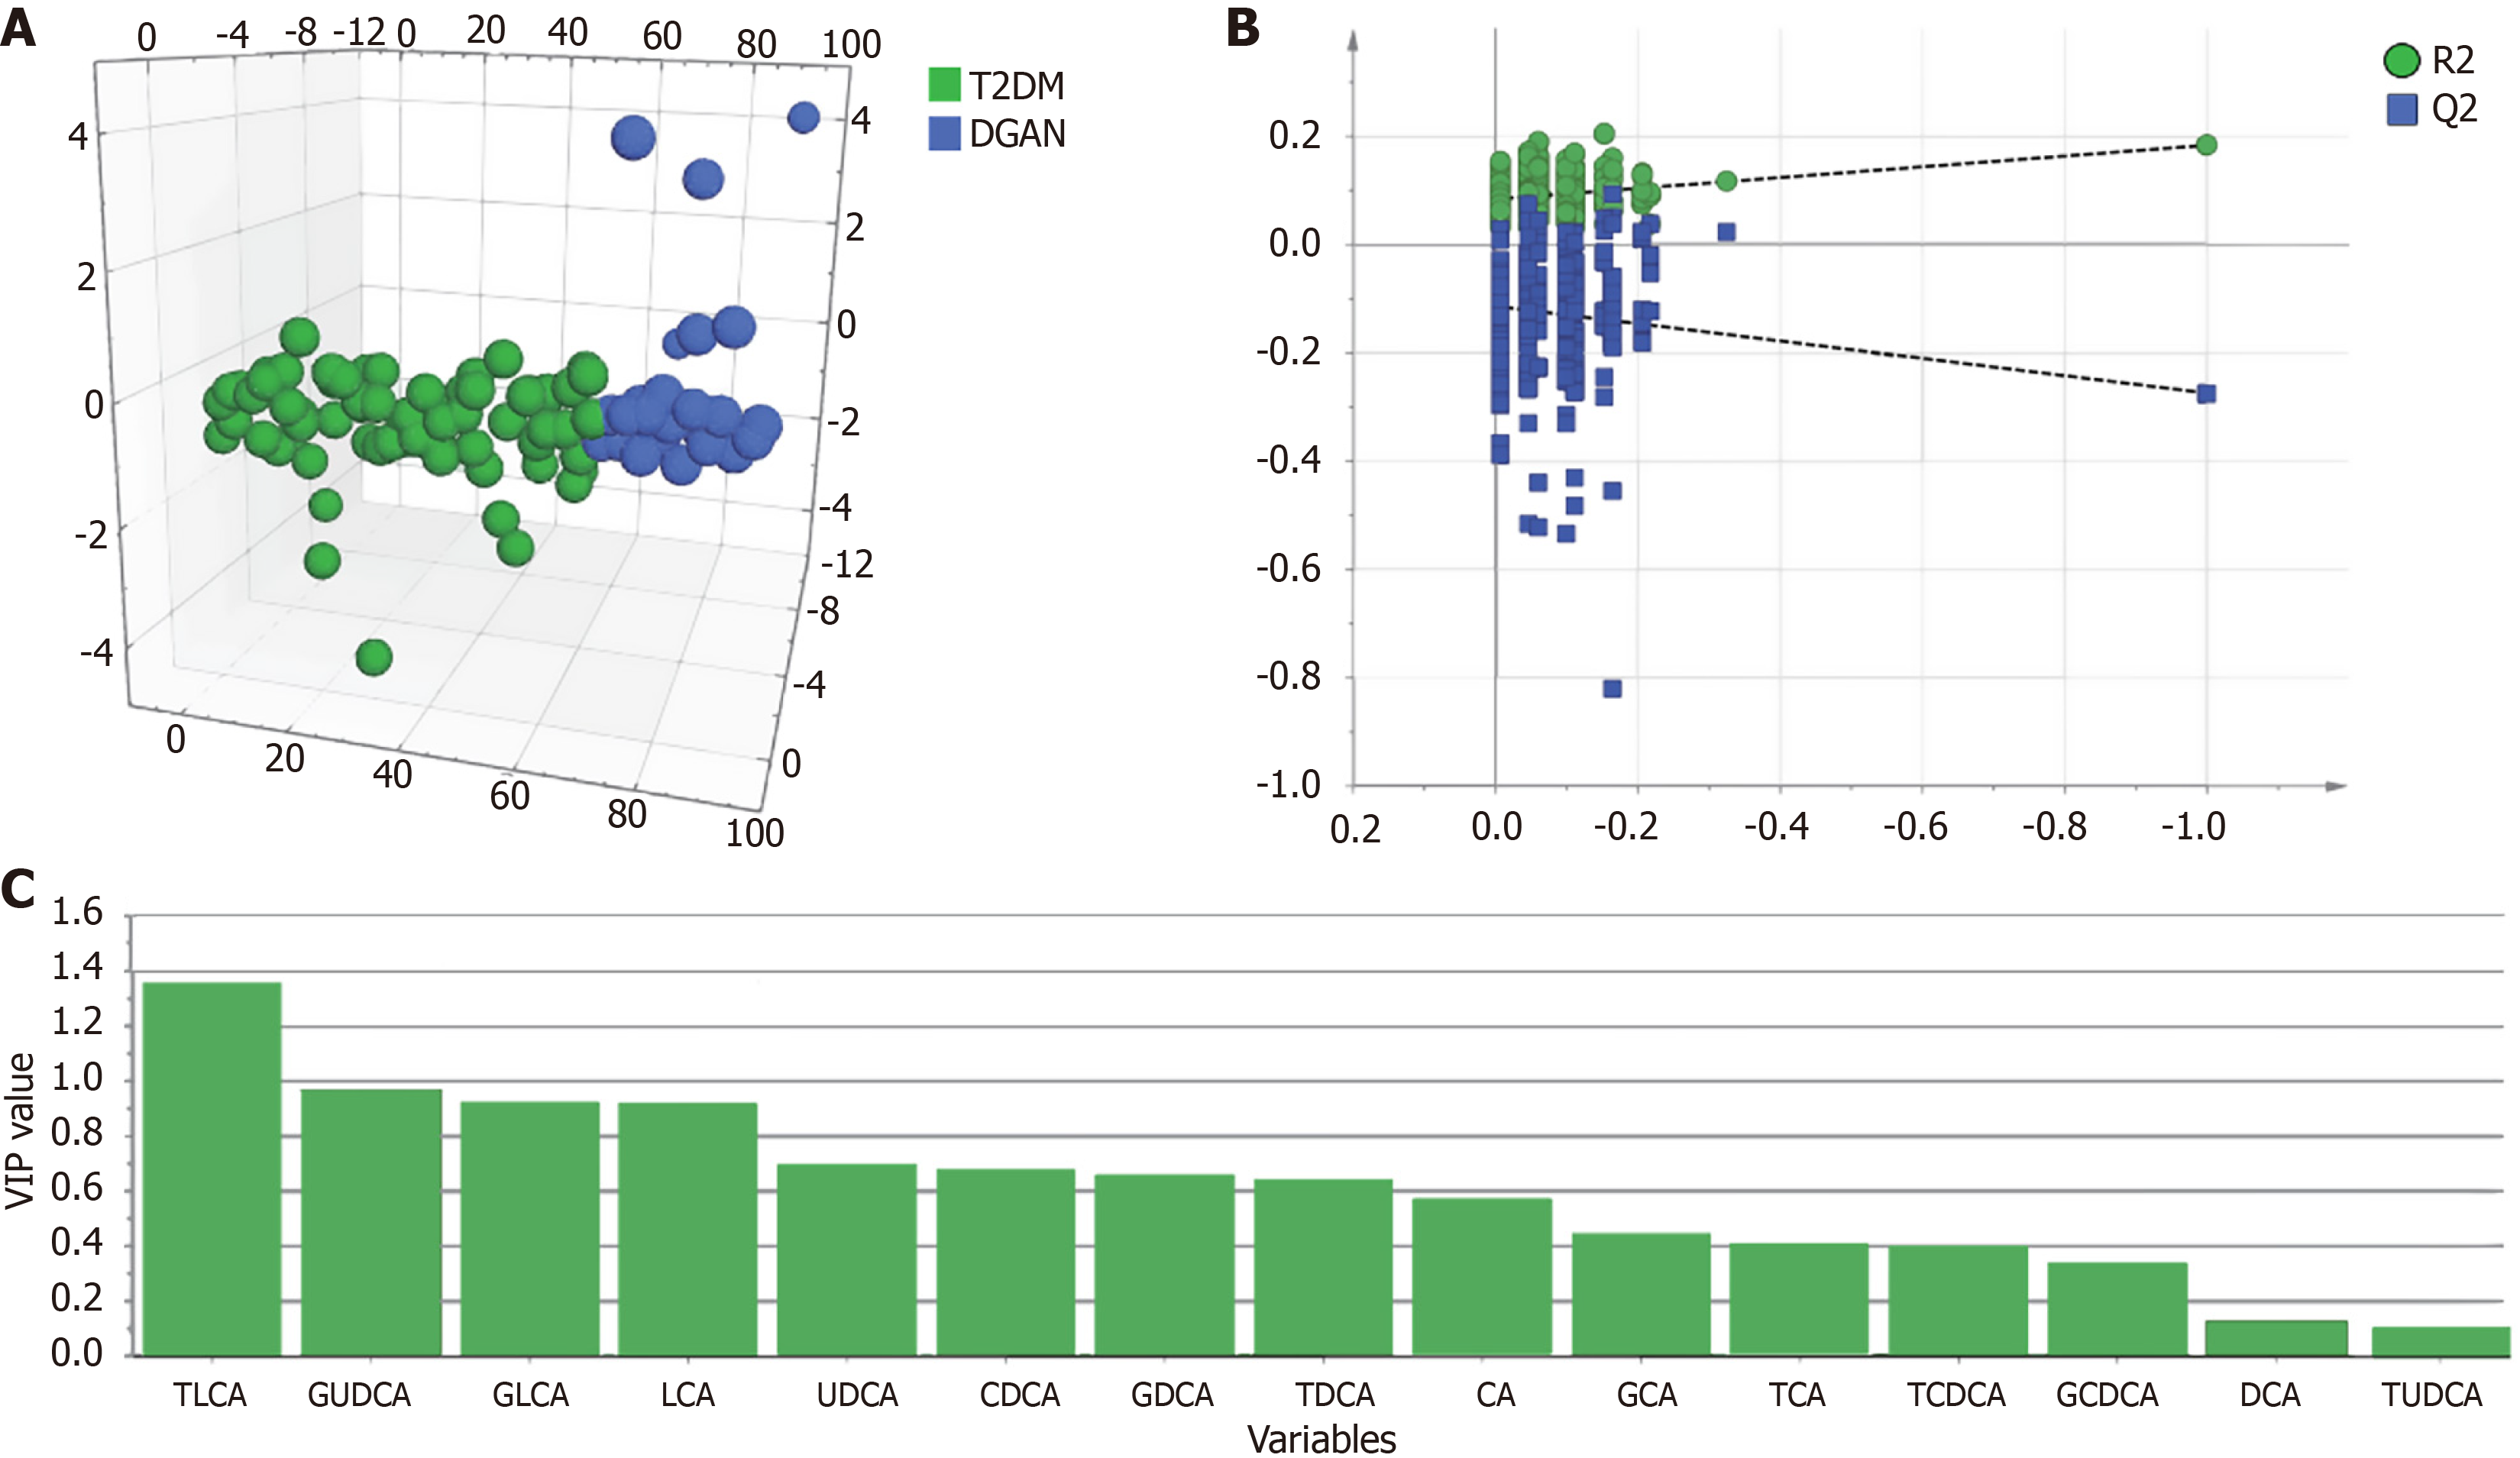
Figure 4 Multivariate analysis of bile acids in the orthogonal partial least squares discriminant analysis model.
A: Orthogonal partial least squares discriminant analysis three-dimensional model between uncomplicated type 2 diabetes mellitus and diabetic gastric autonomic neuropathy. R2X = 0.406, R2Y = 0.183, and Q2Y = -0.274; B: The permutation test demonstrated no overfitting in the orthogonal partial least squares discriminant analysis model [Q2 = (0, -0.386), R2 = (0, 0.152)]; C: The contribution of the metabolites distinguishing uncomplicated type 2 diabetes mellitus from diabetic gastric autonomic neuropathy as indicated by variable importance in projection values. T2DM: Type 2 diabetes mellitus; DGAN: Diabetic gastric autonomic neuropathy; TLCA: Taurolithocholic acid; GUDCA: Glycoursodeoxycholic acid; GLCA: Glycolithocholic acid; LCA: Lithocholic acid; UDCA: Ursodeoxycholic acid; CDCA: Chenodeoxycholic acid; GDCA: Glycodeoxycholic acid; TDCA: Taurodeoxycholic acid; CA: Cholic acid; GCA: Glycocholic acid; TCA: Taurocholic acid; TCDCA: Taurochenodeoxycholic acid; GCDCA: Glycochenodeoxycholic acid; DCA: Deoxycholic acid; TUDCA: Tauroursodeoxycholic acid.
- Citation: Zhu KY, Wang SJ, Li J, Ma PP, Feng SS, Guo L, Lu YB, Dong L, Ding DF. Association of serum bile acid profiles with the risk of gastrointestinal autonomic neuropathy in patients with type 2 diabetes mellitus. World J Diabetes 2026; 17(2): 112859
- URL: https://www.wjgnet.com/1948-9358/full/v17/i2/112859.htm
- DOI: https://dx.doi.org/10.4239/wjd.v17.i2.112859