
















©The Author(s) 2026.
World J Diabetes. Feb 15, 2026; 17(2): 112534
Published online Feb 15, 2026. doi: 10.4239/wjd.v17.i2.112534
Published online Feb 15, 2026. doi: 10.4239/wjd.v17.i2.112534
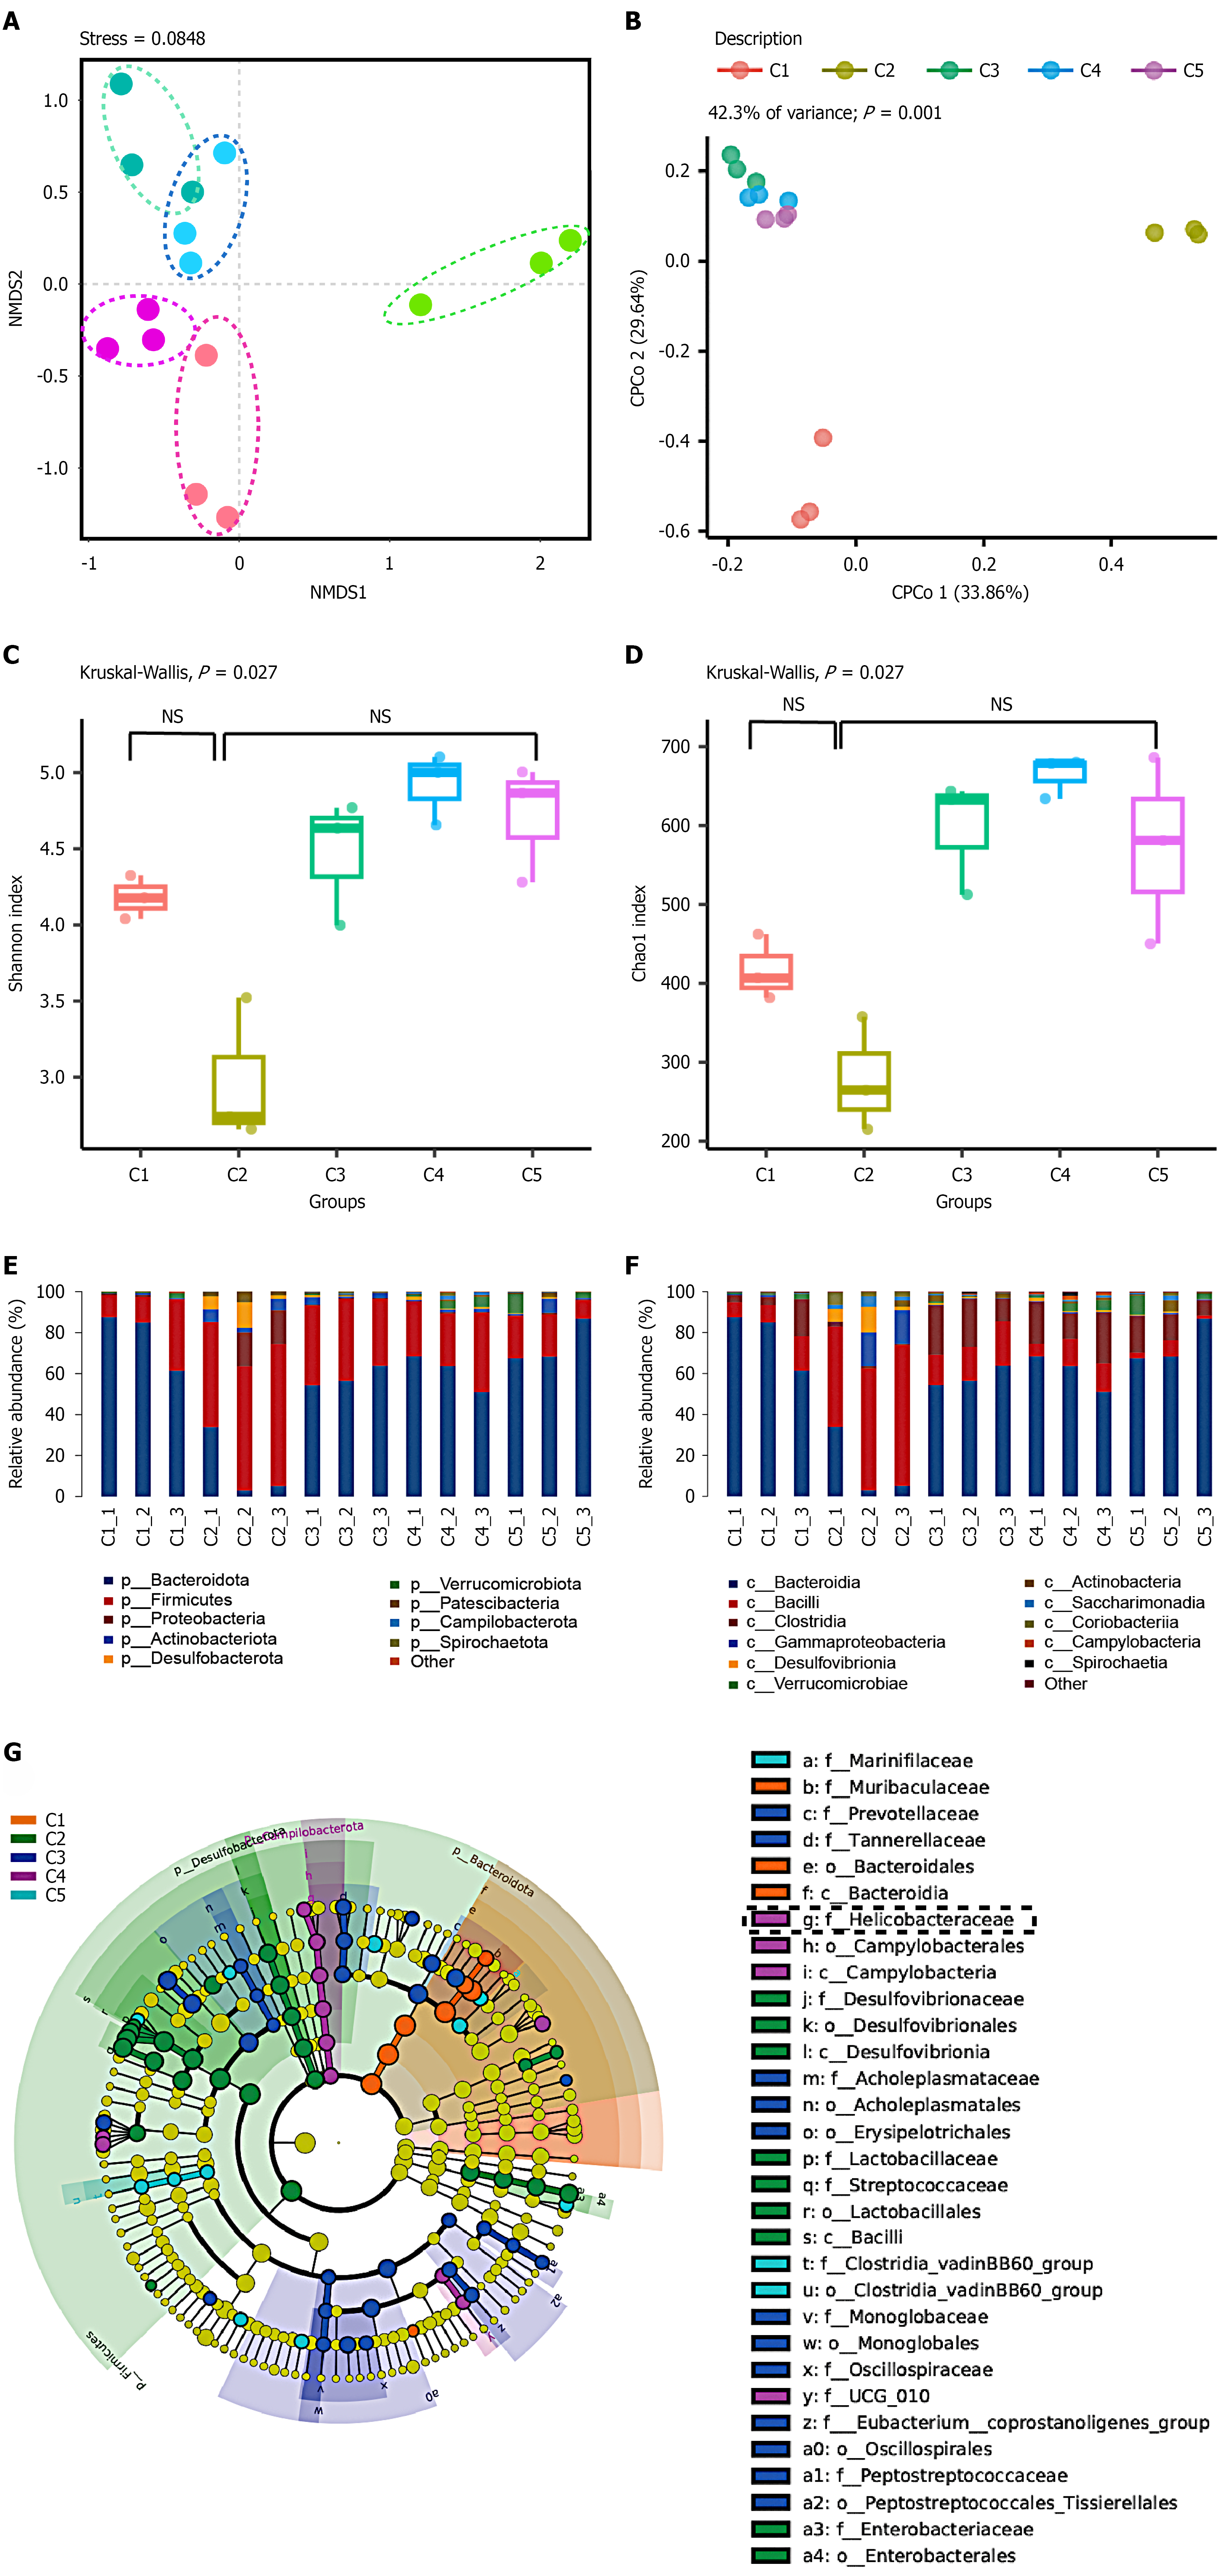
Figure 6 16S ribosomal RNA sequencing and bioinformatics analyses of feces from diabetic mice infected with Helicobacter pylori.
A: Beta diversity of the microbiome; B: Canonical correspondence analysis plots; C and D: Alpha diversity; E: Relative abundance of the microbiota at the genus level; F: Relative abundance of the microbiota at the phylum level; G: Linear discriminant analysis effect size comparison of the gut microbiota. C1, C2, C3, C4, and C5 represent pre-infection, and post-infection in the 1st, 5th, 9th, and 13th months, respectively. NSP > 0.05, aP < 0.05, bP < 0.01, cP < 0.001, dP < 0.0001.
- Citation: Yang WP, Zeng JH, Wu BL, Zhou WT, Luo JZ, Dai YY, Yang SX, Huang ZS, Huang YQ. Pathological effects of diabetic mice with Helicobacter pylori infection. World J Diabetes 2026; 17(2): 112534
- URL: https://www.wjgnet.com/1948-9358/full/v17/i2/112534.htm
- DOI: https://dx.doi.org/10.4239/wjd.v17.i2.112534