
















©The Author(s) 2026.
World J Diabetes. Feb 15, 2026; 17(2): 112500
Published online Feb 15, 2026. doi: 10.4239/wjd.v17.i2.112500
Published online Feb 15, 2026. doi: 10.4239/wjd.v17.i2.112500
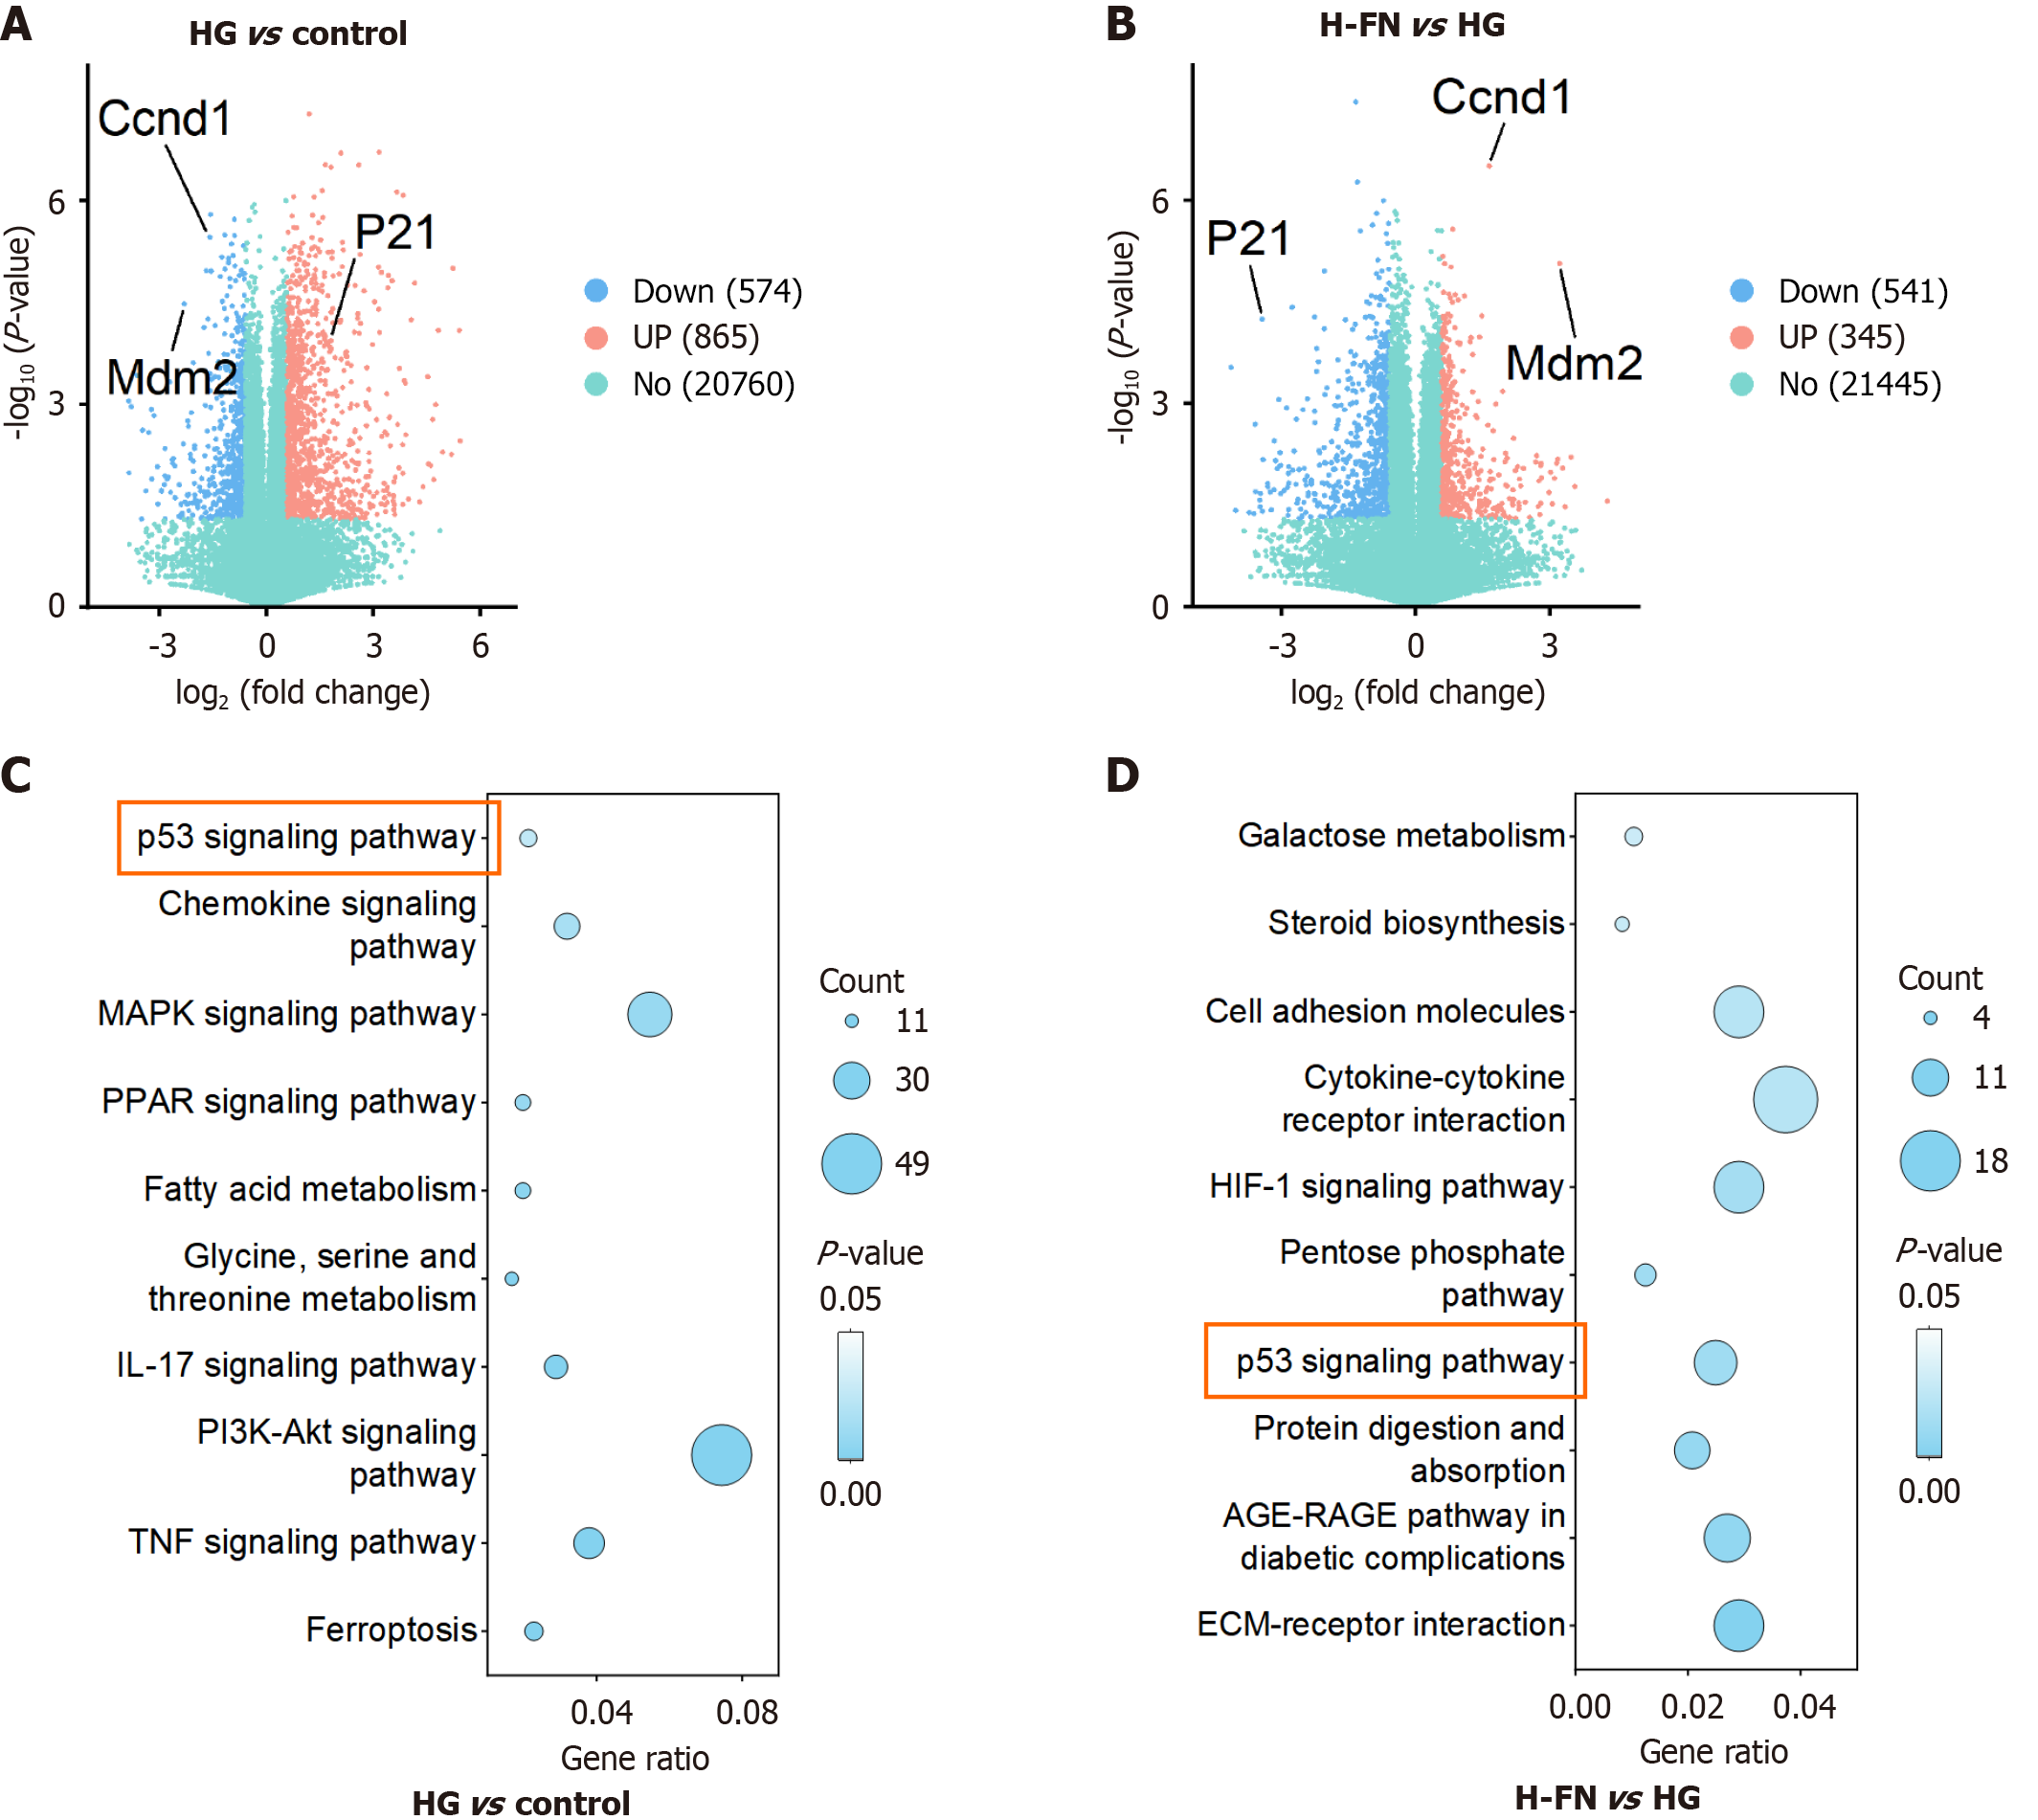
Figure 2 Impact of formononetin intervention on the transcriptome of high glucose-exposed MPC-5 cells.
We performed transcriptomic analysis on control, high glucose (HG), and HG + high dose of formononetin (H-FN) groups. Differentially expressed genes (DEGs) were filtered with a criteria of |Log2(FoldChange)| ≥ 1 and Padj ≤ 0.05 (n = 3 per group). A: Volcano plots of DEGs in HG vs control groups; B: Volcano plots of DEGs in H-FN vs HG groups; C: Kyoto Encyclopedia of Genes and Genomes (KEGG) pathway enrichment analysis of DEGs in HG vs control groups; D: KEGG pathway enrichment analysis of DEGs in H-FN vs HG groups. HG: High glucose; H-FN: High dose of formononetin; IL-17: Interleukin-17; TNF: Tumor necrosis factor.
- Citation: Ji Y, Liu RX, He PY, Zhou YM, Li YC, Guo J, Nie B, Liu YN, Liu WJ. Formononetin inhibits p53 signaling pathway activation to delay cellular senescence and ameliorates diabetic kidney disease. World J Diabetes 2026; 17(2): 112500
- URL: https://www.wjgnet.com/1948-9358/full/v17/i2/112500.htm
- DOI: https://dx.doi.org/10.4239/wjd.v17.i2.112500